


Have you ever found yourself staring at a huge chunk of text and struggling to make sense of it? Maybe you've tried highlighting keywords or skimming through it, but still, the information doesn't seem to stick.
Well, fear not, because today we're going to talk about a powerful data visualization tool that can help make sense of text data: word clouds!
Word clouds, also known as tag clouds, are a visually stunning way to represent textual data. They display the most frequent words in a piece of text as larger and bolder, giving a quick snapshot of what the text is all about.
In this short blog, I will show you how to quickly create a stunning word cloud in Tableau. Follow these instructions with your own data to build your word cloud in Tableau.
First things first, we need some text data. For the purpose of this example, I have used a bestseller... the bible. To process the verses in the bible, I used Alteryx (a data processing software) to parse out each verse and count the occurrence of individual words in the bible. A special mention is due to the text pre-processing tool which allows you to filter out stop words, lemmatize, and format the text in a consistent way. Here is the resulting dataset loaded in Tableau:
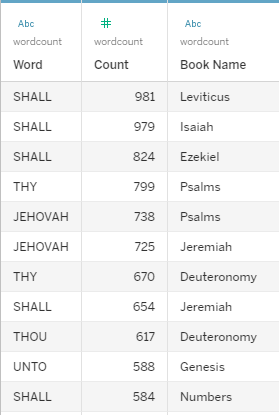
At the row level, we have individual words and the number of occurrences of that word in each book of the bible. Next, we need to create a new worksheet. In that new worksheet, drag the "Word" field into the "Text" shelf and select "Text" in the Marks dropdown selection.
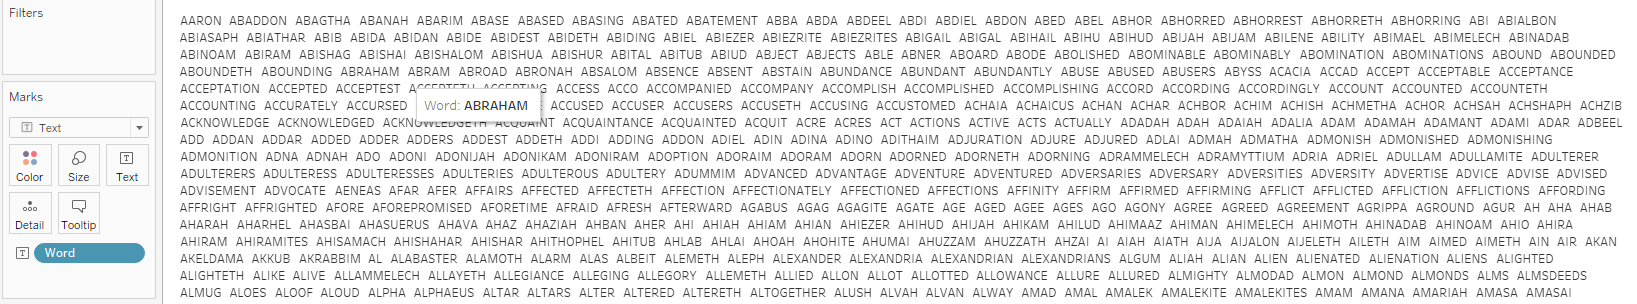
You now get all of your words as a list and the next step is to filter out words with a small number of occurrences. To do that, drag the "count" field in the filter as a continuous value and select the range of values you want to keep in the view.
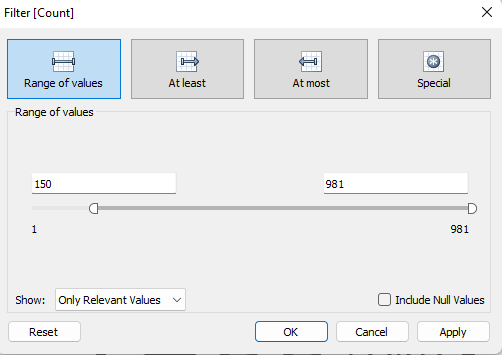
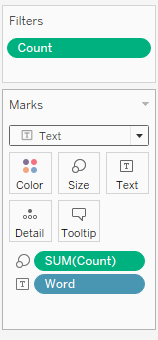
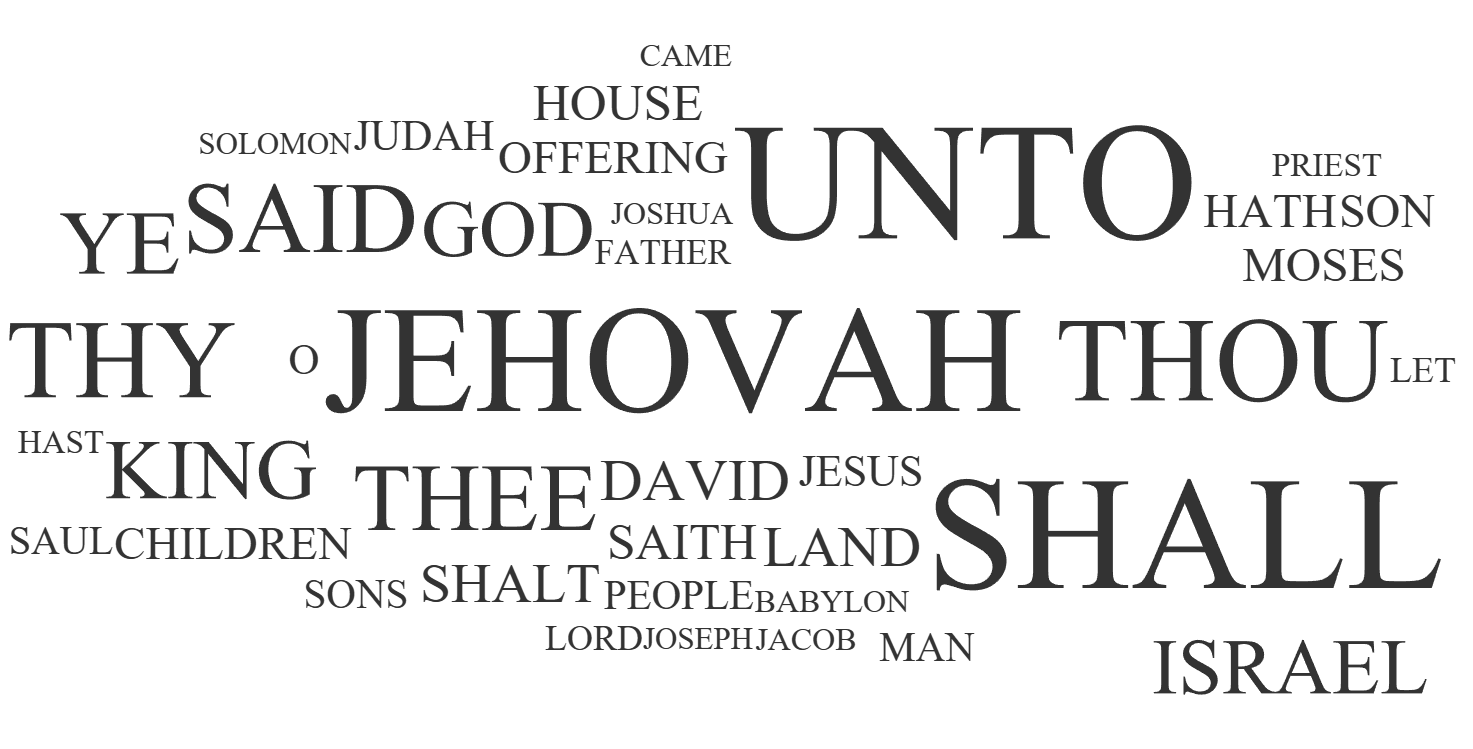
Here, I kept words that appeared more than 150 times in the bible. Then, drag the sum of 'Count' onto the size shelf
You are now done, take a look at the word cloud you created!
Finally, we need to save our creation. Click on "File" and select "Save to Tableau Public" to showcase your visualization to the world. And voila! You've just created a stunning word cloud that can help you quickly understand and analyze textual data.
If you want to take a look at the simple dashboard I created from this word cloud, follow this link: https://public.tableau.com/views/BibleWordcloud/Dashboard1
If you want to understand the data processing behind the count of individual words in the bible, here is a packaged workflow containing the original dataset and the workflow I used: