After a great 4 months of training, we get to cap off our experience with a week of intensive dashboarding. Every day, we will be receiving a data set, prepping the data, visualizing the data, presenting our findings, and then writing a blog on our experience.
So, today was our first day. In the morning we learned about accessibility in Tableau and just being mindful that some people may not be able to interact with Tableau for any number of reasons. It is best to know your audience so you can make your visualization more accessible. Accessibility can be overwhelming when thinking of all the things you could do to better assist people but we can start by breaking it down at its core.
What is accessibility? The way I interpret this term is anything that increases the ability to understand something. As data visual experts, we already push the boundaries of accessibility but how do we branch over to the individuals that may have other disabilities, whether that is the lack of ability to see or see certain colors, lack of focus, or lack of the ability to use a mouse and trackpad. These are all the things we have to consider when creating dashboards in the future.
This leads me to the project for the day. We received a dataset on FixMyStreet from the UK. For those in the US, this is an application that people can use to report pavement imperfections such as potholes. The app can use geocoding to label that address and flag it. Our task was to make a visualization of this data that could be accessible to as many people as possible.
The Dashboard:
This is what I came up with in the 3.5 hours:
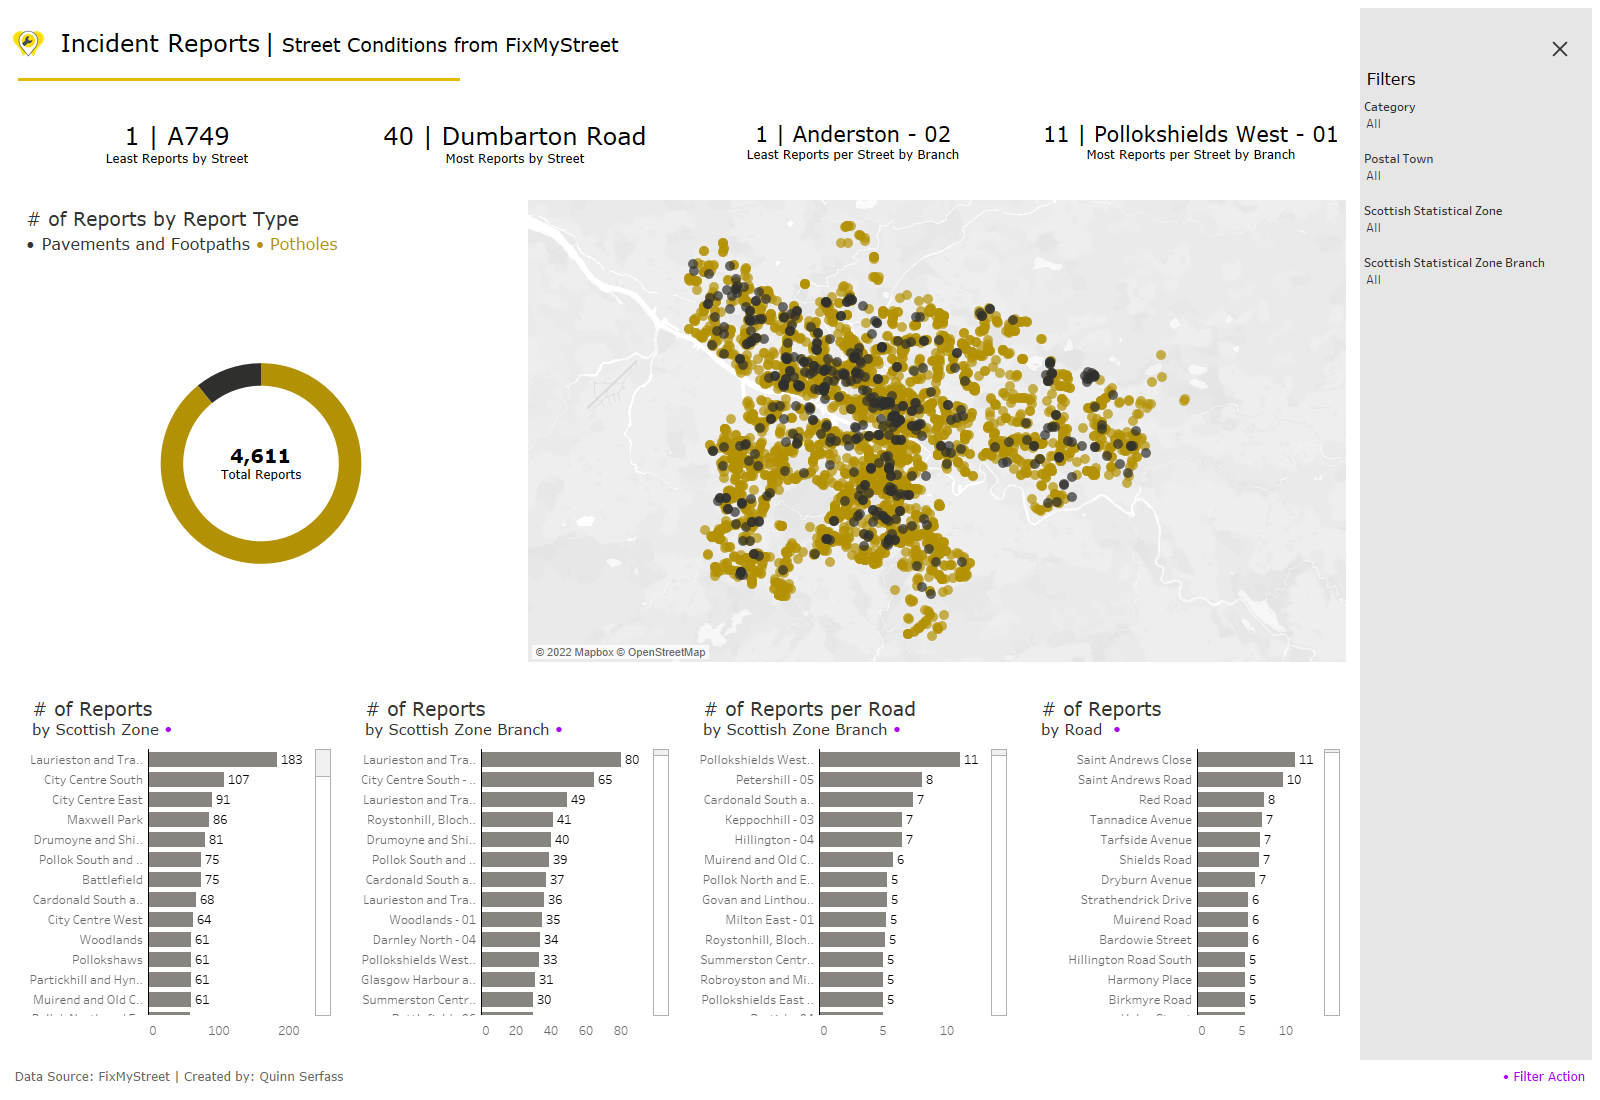
My goal was to be able to keep the normal interactivity while allowing for other improvements but I will get to that in a second. Let's work our way through this dashboard.
To start, we have 4 KPIs or big picture numbers that describe 4 different things.
1.) Least Reports by Street
2.) Most Reports by Street
3.) Least Dense Reports by Scottish Zone
4.) Most Dense Reports by Scottish Zone
Moving forward, we have a donut chart breaking down the two types of reports, pavement reports, and pothole reports. Next to it is a map that shows all of the reports, associated with the same colors from the donut chart. On the bottom, we have 4 charts that break down the granularity of the locations. Lastly, on the right, I included a collapsible menu that can filter based on the type of report, the town, the zone, and the street.
Interactivity:
The main interactive element is that you can click on a bar and everything will dynamically change around it. This includes a focused map and the ability to drill down further in granularity. I chose to do 4 different bar charts rather than a drill-down set in case someone was a keyboard user only.
Colors:
The color choice was based on two factors. For one, the website used these colors so I thought it was best to stay on brand. Second, we want to make sure there is high contrast between all of the colors and that it passes the colorblind test which you can find on either Coolors or Adobe Color. I made the yellow a little bit darker to contrast the white background.
Universal Design Principles:
Using universal design principles in a visualization like this could prove to be very useful, especially if your audience is very diverse. If you do not know what a universal design principle is - think of it this way. You could build stairs and a ramp or you could try to integrate them so you can knock out two birds with one stone.
When thinking about accessibility, it isn't '100% accessible' or '0% accessible', it is somewhere in between. If you remove some elements, it could make the dashboard more or less accessible to others. It all depends on your audience. However, some things in visualization can do both at the same time. For example, having the graphs axis on the left is natural at this point but people read left to right so it makes sense. Or, having mark labels on may allow for keyboard-only users to see the refined data without clicking the bar, but it also helps executives that don't want to go into Tableau and take screenshots.
Accessibility:
In terms of accessibility, I added a few things to expand the range of users. For starters, the KPIs are sheet titles, this allows for on-screen narration to speak the title which can be helpful for those who have sight impairments.
The colors chosen are colorblind-friendly, high contrast and they are consistent for those who may have neurodevelopment conditions.
The filters menu can be accessed with only the tab and enter buttons which can help those who are keyboard only.
The text is Verdana which can help break up imposter characters, like I and l.
Lastly, all bars on a bar chart were labeled in case the user uses keyboards only, which limits the ability to see tool tips.
Future Considerations:
Due to some time constraints, not everything ended up getting completed. Additionally, the rest of my cohort presented their dashboards and we all learned from each other by the end. Here are a few future considerations:
1.) White text in titles so a summary can be read to the user if they have the narrator on.
2.) Have an export to excel navigation button to allow keyboard-only users to look at the back-end data.
3.) A filter or parameter that allows us to limit the number of bars on the screen. This decreases the need to scroll through all the bars although it also limits the data being seen by the user which could be limiting.
4.) Take out the 'Least' amount of reports - people in this industry will most likely not care about the nicer roads. Conversely, if a user of the app saw that these roads are in better condition, it could be useful. This goes back to the 'audience' conversation.
5.) I created a field based on two dimensions that added some granularity - since I made this change, I should define it in the visual as well since it is not in the original data.
6.) Some of my fonts are a bit too small so just making the fonts larger could help people with visual impairments.
7.) Since the filters menu is usually collapsed, add some sort of instruction that allows the end user to know that there is something inside that hamburger menu.
8.) Some of the speech isn't working out as great as I would like so fixing that up.
9.) Adding streets onto my map. The whole visual is surrounded by the idea of streets and I completely left that aspect out.
That wraps it up for day 1, I hope you enjoyed today's little write-up and learned a little more about why accessibility is important and how we can practice expanding the audience!
Here's a link to the actual viz on Tableau Public - catch you on the flip: