This is second day of dashboard week where we get tasked to create fake data on selected industry using Mockaroo, create dashboard from that fake data on PowerBI and write blog on that before 3:30PM. In short in 3.5 hour we have to create fake data and create dashboard on PowerBI and write blog. At 3:30 we all present our work.
I choose Retail industry to create fake data because I thought it would be easy to create data similar to Superstore as we are already familiar with the data. But I ended up using 1.5 hour to create fake data. Believe me it's not easy to create superstore data if you haven't used Mockaroo for long time.
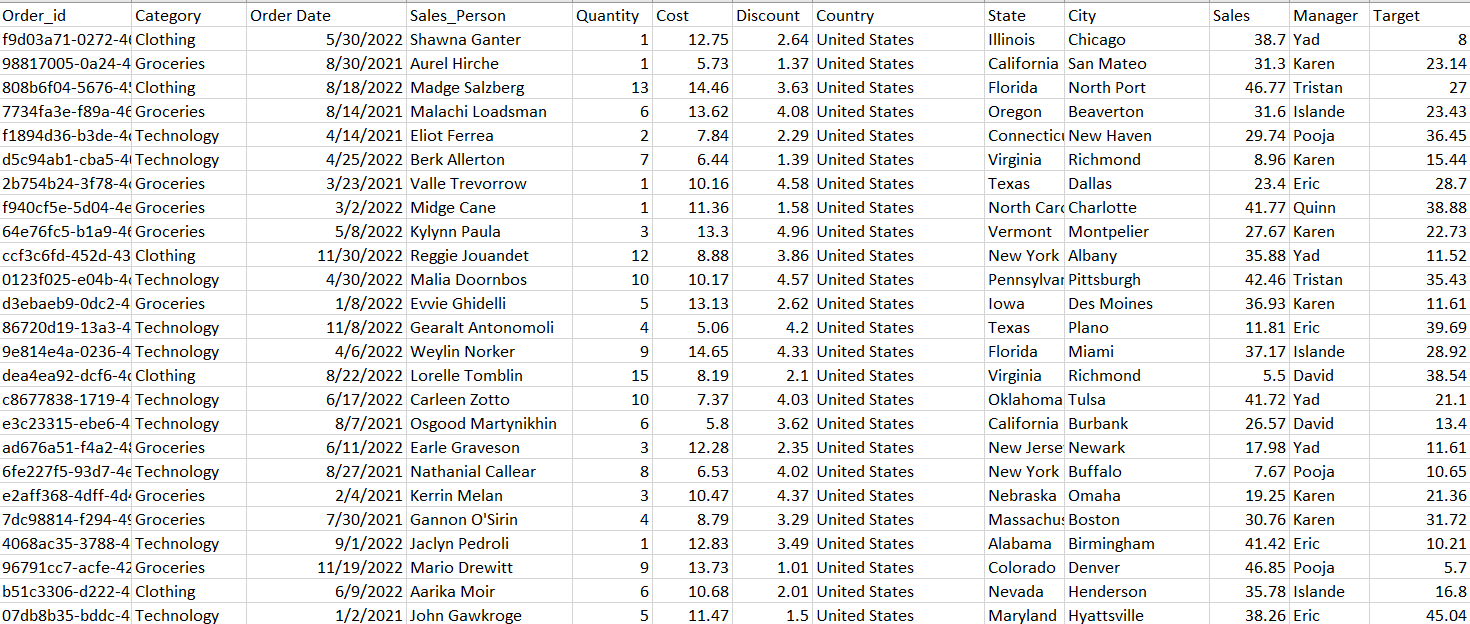
This is a snippet of fake data which I created for retail industry.
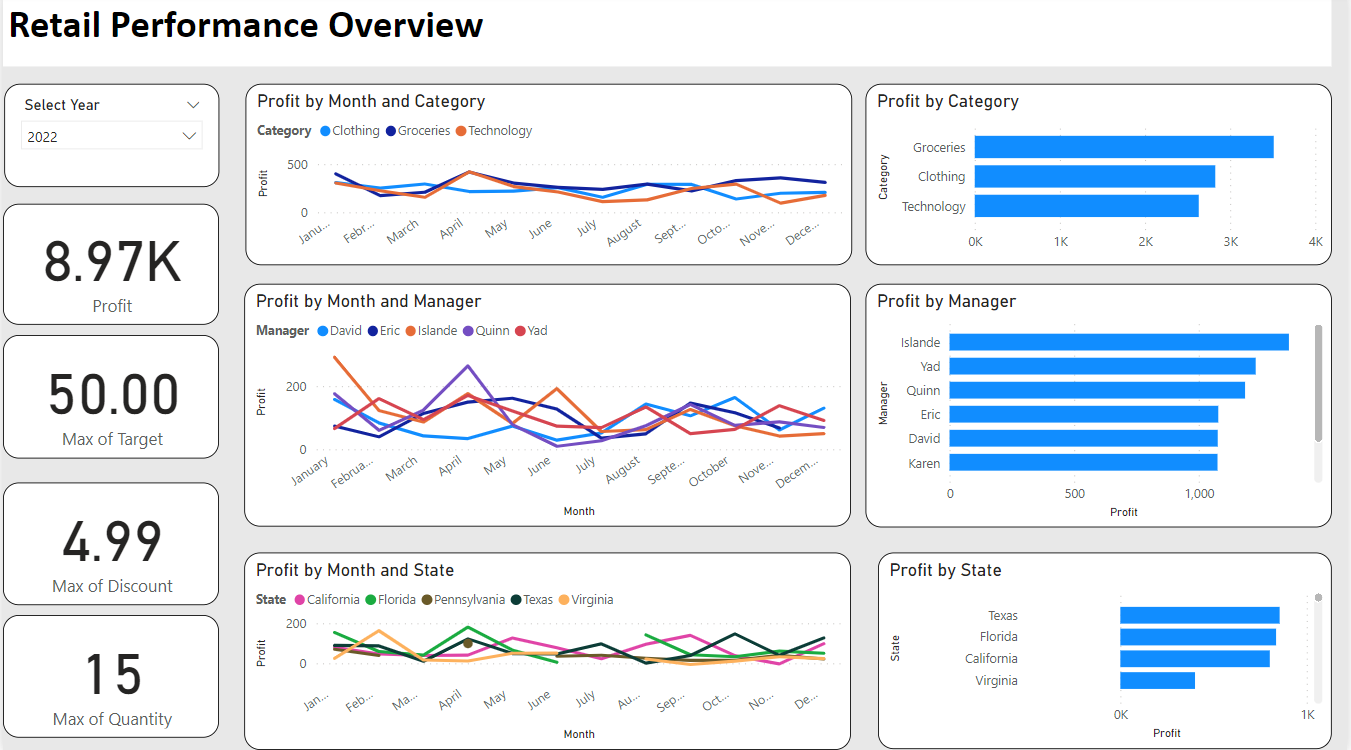
Now I started building my dashboard. I created some KPI based on profit, target, discount and quantity. After that I used line chart to see performance of category, managers and state based on profit. As managers and state numbers are high so I filtered them and focused on top5 only. After line chart I build some bar chart which are similar to line chart but they didn't break down in months.
This is the final output of my dashboard-
I hope this blog helps you to understand how easily you can build dashboard on PowerBi.