The dashboard task is not as complicated as previous days, which is nice:)
The data I downloaded are from the internet boyband database gathered by Billboard.com
Dataset for bands : https://github.com/the-pudding/data/blob/master/boybands/bands.csv
Dataset for boys: https://github.com/the-pudding/data/blob/master/boybands/boys.csv
Then I joined those two tables together in Tableau, because the data was quite clean and didn't need much cleaning.
The data contains information about 55 boybands that had at least 1 song chart on the US version of the Billboard Hot 100 between 1980 and 2018. Also, it contains appearance information for the 234 boyband members that were featured in the band's music video in their highest ranking/earliest song.
My final dashboard looks like below:
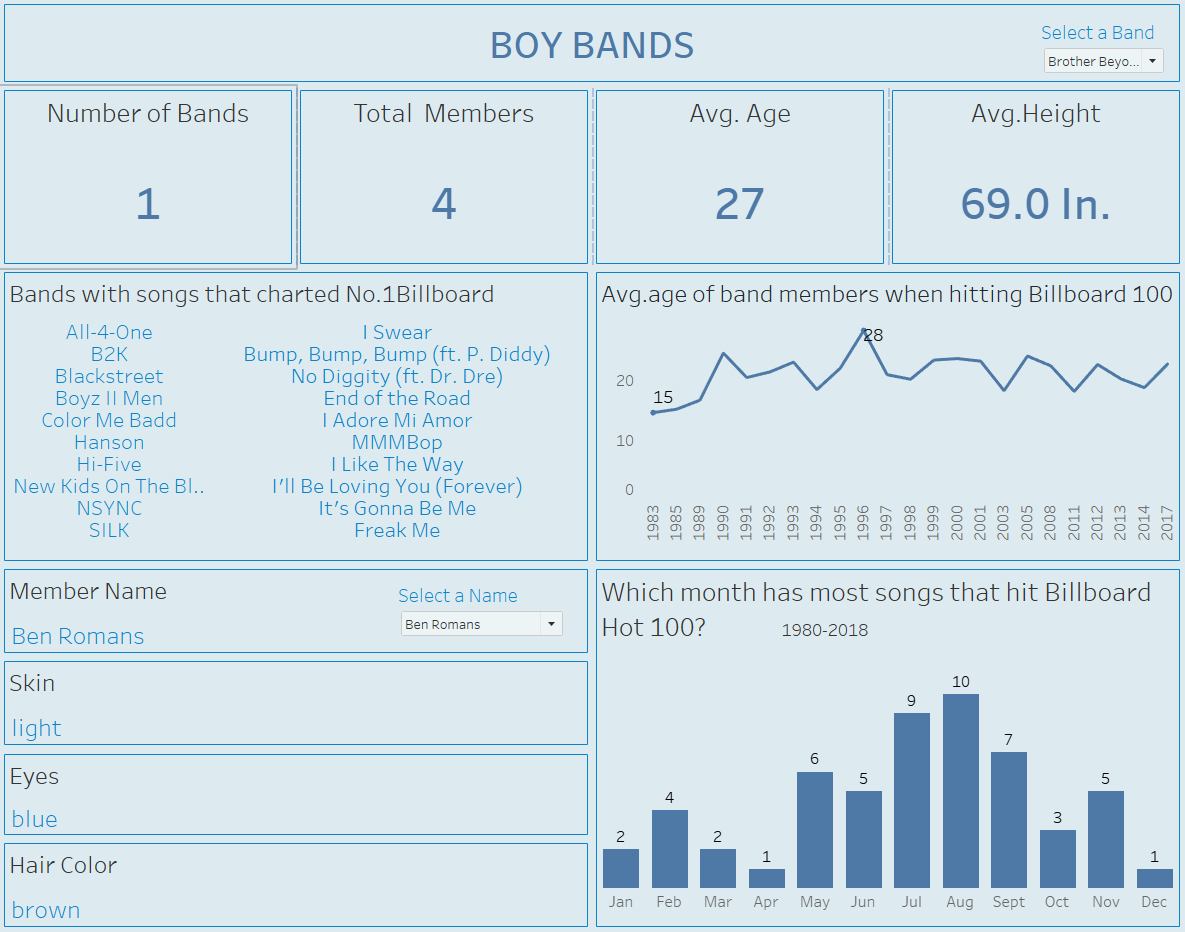
There are two filters to filter down into a particular band or a member from boy band for more detailed information.