I wrote this post while listening to this song. 🎧 Hit the play button and enjoy!
Today is the last day of dashboard week. The Today's is:
The applicants have about 2 weeks; our teams have about 6 hours. Let's see how they do.
The data is based on the hit TV show Survivor and is provided in two formats.
1. castaway_season_combined.xlsx - This file contains two sheets, Data and Data Dictionary. The Data table is a joined version of three tables in the survivoR dataset: castaway, castaway_detail, and season_summary. The Data sheet contains the joined tables and the Data Dictionary sheet provides a description of each field as well as its source table. The Data Dictionary sheet also contains an important note regarding the granularity of the data.
This is the only data provided that we have documented. It is provided to be the base data from which you can build any number of visualizations and has plenty of room for interesting analysis. You will not be docked for using only this data in your final visualization.
2. Survivor-full-data.xlsx - This is an extra excel file that contains a sheet for every table of the survivoR dataset. It is provided for those who are interested in the full data. We do not provide any documentation on the fields in these tables or the join keys. This information can be found in the survivoR Github repo. They are welcome to use data from these tables in your final visualization but it is not required.
I've never watched this TV show and my first step was looking for some information. I used wikipedia. Also, as the other previous dashboards, I researched for references on Google Images, Pinterest and Tableau Public.
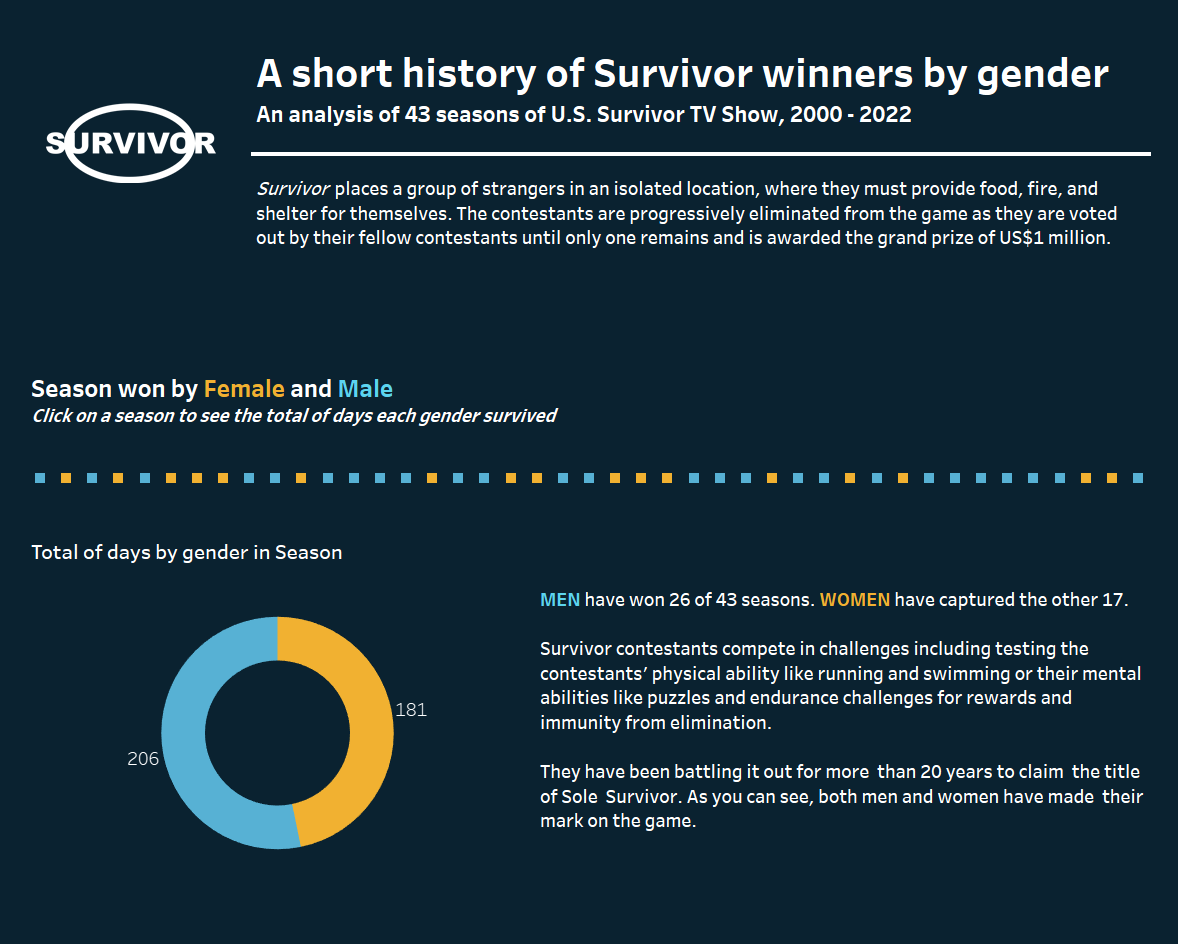
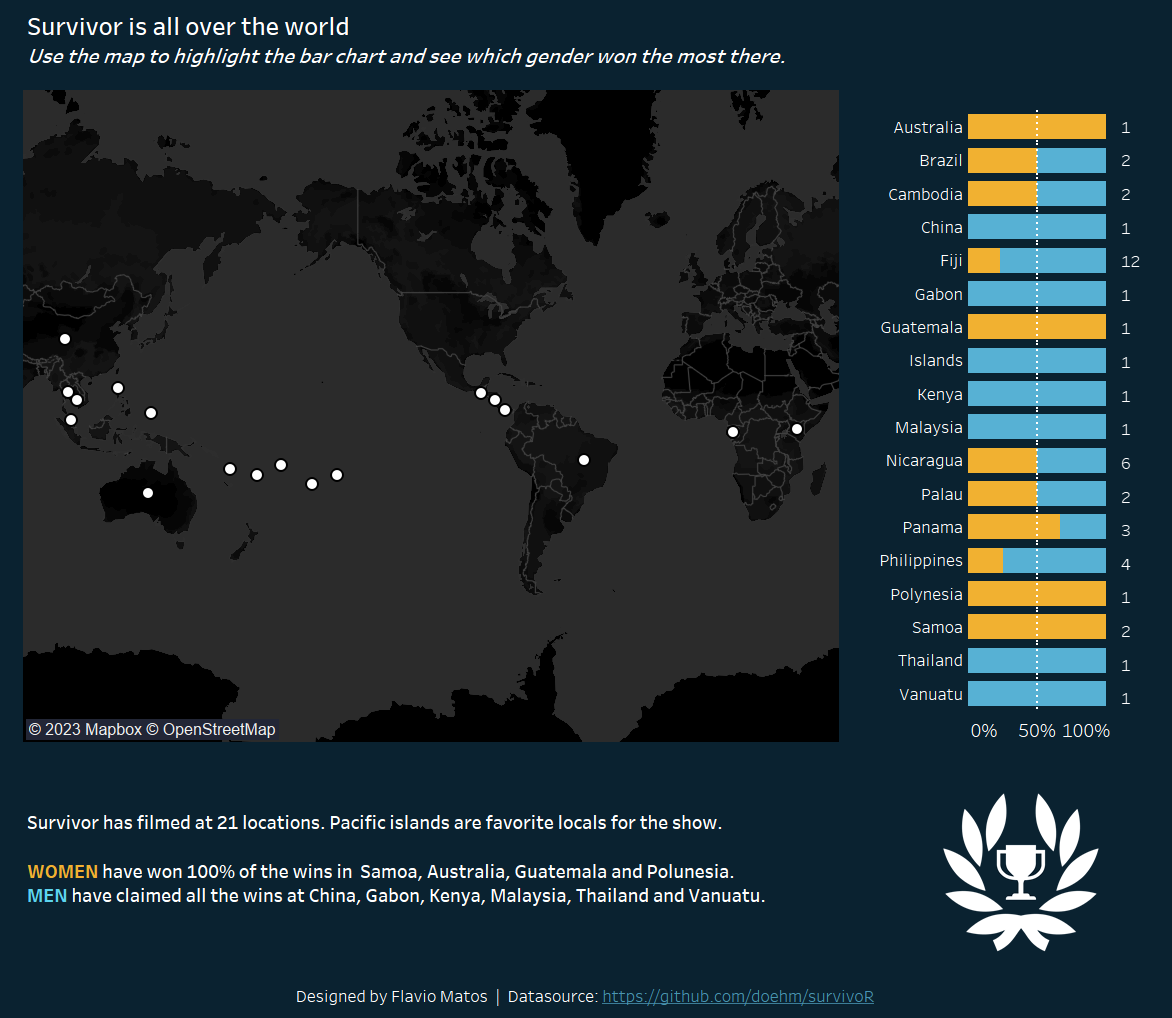
I decided to do an analysis by gender. So I wanted to show all winners and how far they went in the show by gender as well.
Then I started doing my sketch. I used my notebook to draw this time. I thought it was easier than use Excalidraw.
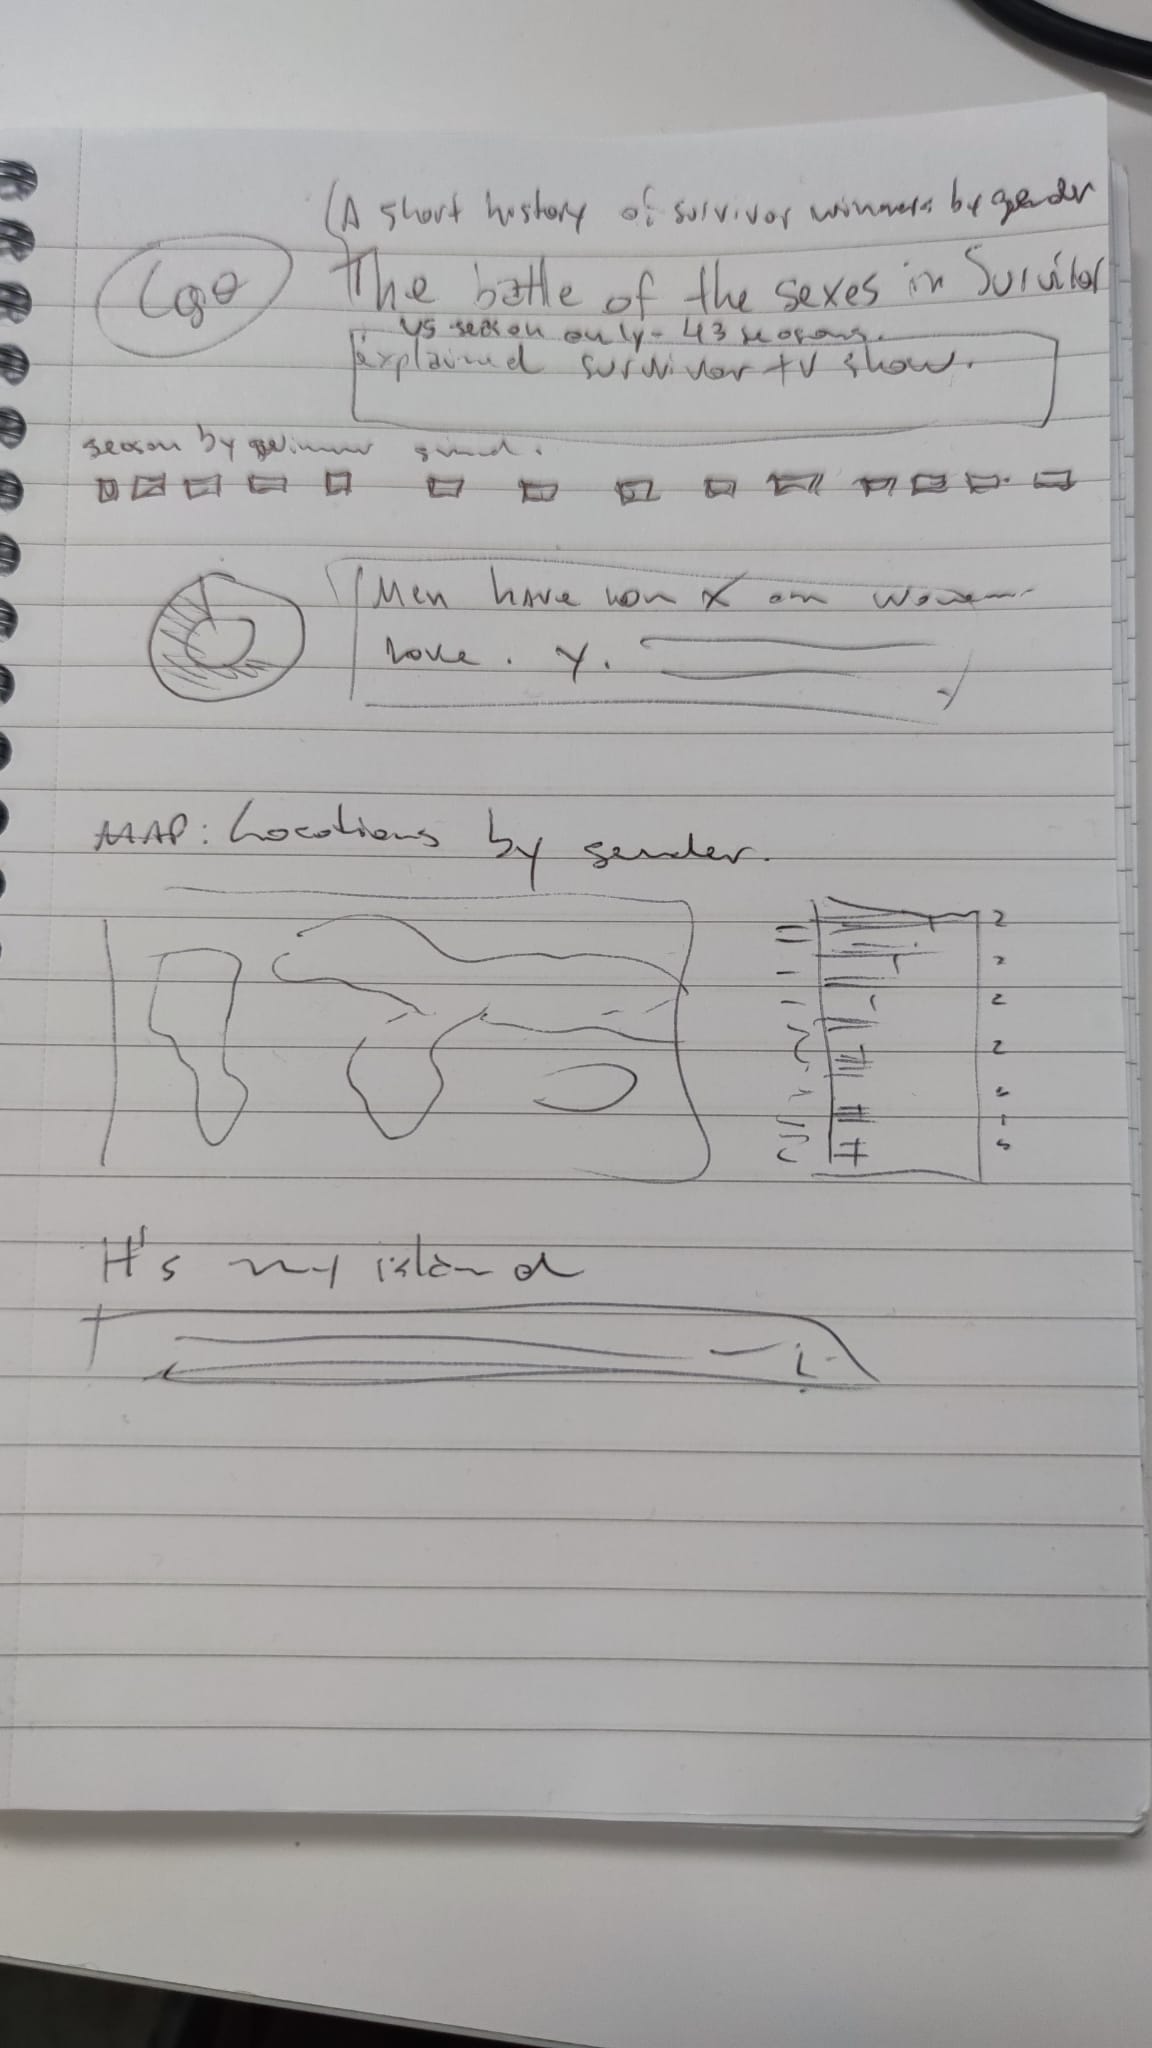
I know it's hard to read the sketch but I swear it makes a lot of sense for me - lol
Finally, here's my last dashboard of the week. I had some difficults at the end with formatting. When I uploaded to Tableau Public all the fonts changed to a small size. I need to correct that, but for now I will leave it as it's because I have to present in 20 minutes.
I decided the colours for this dashboard more because of the contraste than anything else. I might be not color-blind friendly, so I will change it in the future.
That's it! Last dashboard of training! It's crazy how time flies by.
I want to thank you all the coaches and my fellow DSers for the supporting they have provided.
I'm excited about next steps and ready for my first placement.
- For more tips follow me on LinkedIn and Twitter.
- You can check out my portfolio on Tableau Public.