


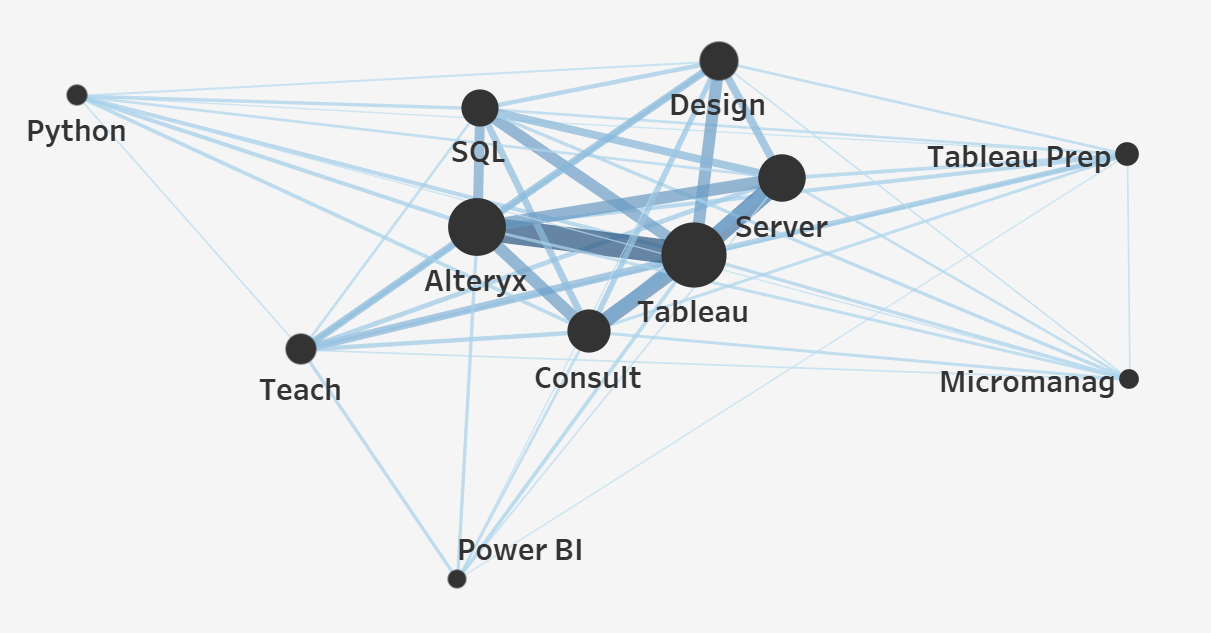
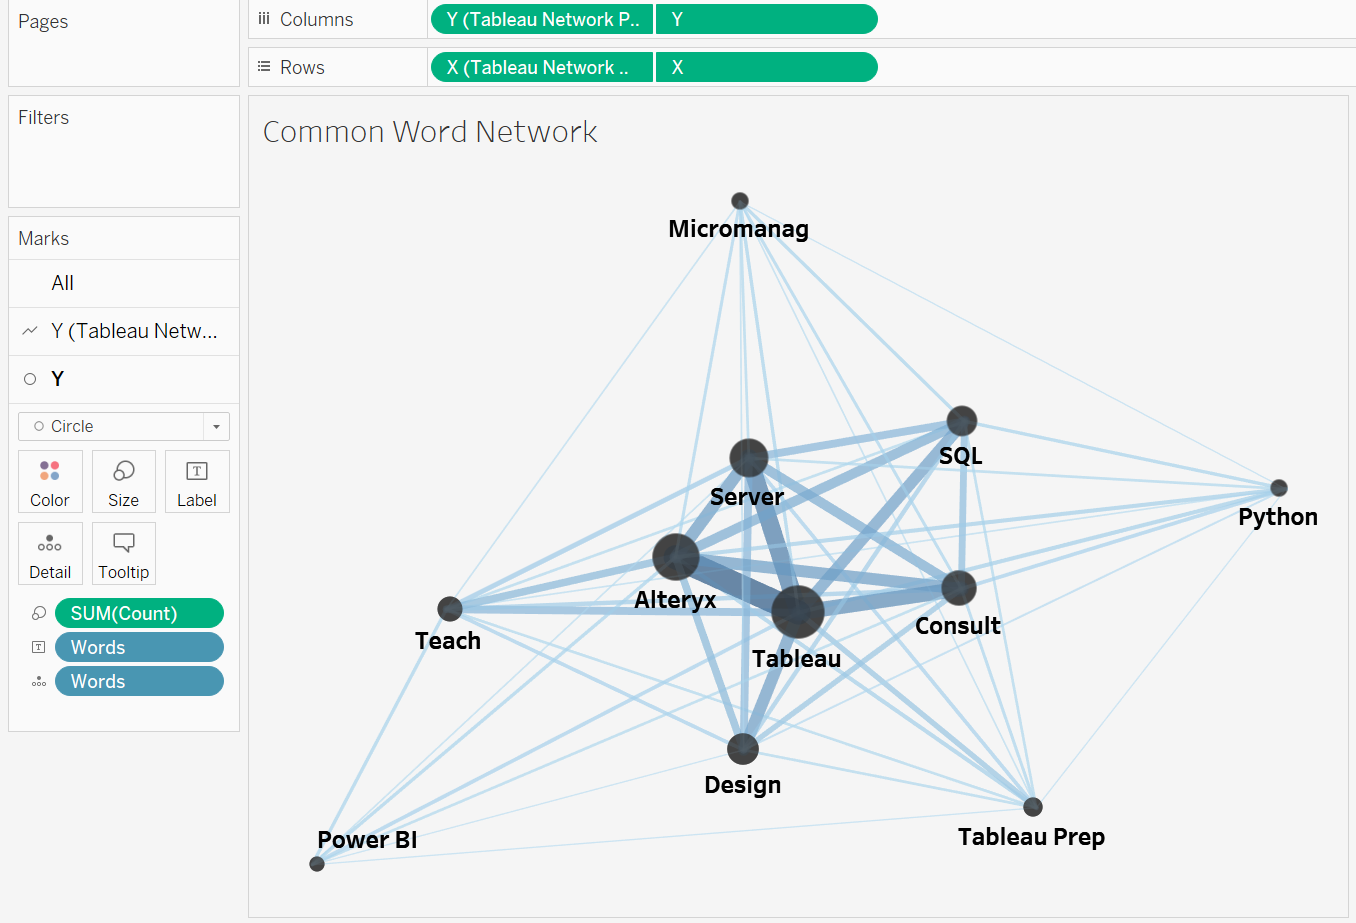
Network Graphs can be great for visualising the relationships between points. In the following graph, I show the relationships between certain words in a set of blogs. The circles, or nodes, represent the words of interest, and the size of the nodes show how common the words were. The lines, or edges, represent blogs mentioning both words. The thickness of the edges show how many blogs mentioned both words.
These network graphs are a powerful visual way of showing the relationships between data points, but can be a challenge to build using Tableau. Tableau needs the X and Y coordinates of each node and edge in order to build a network graph, and there is no obvious way of obtaining them. For a small dataset you could write them yourself, but this quickly becomes unrealistic when trying to build a large network diagram. For these you need to run an algorithm to generate the X and Y coordinates for you.
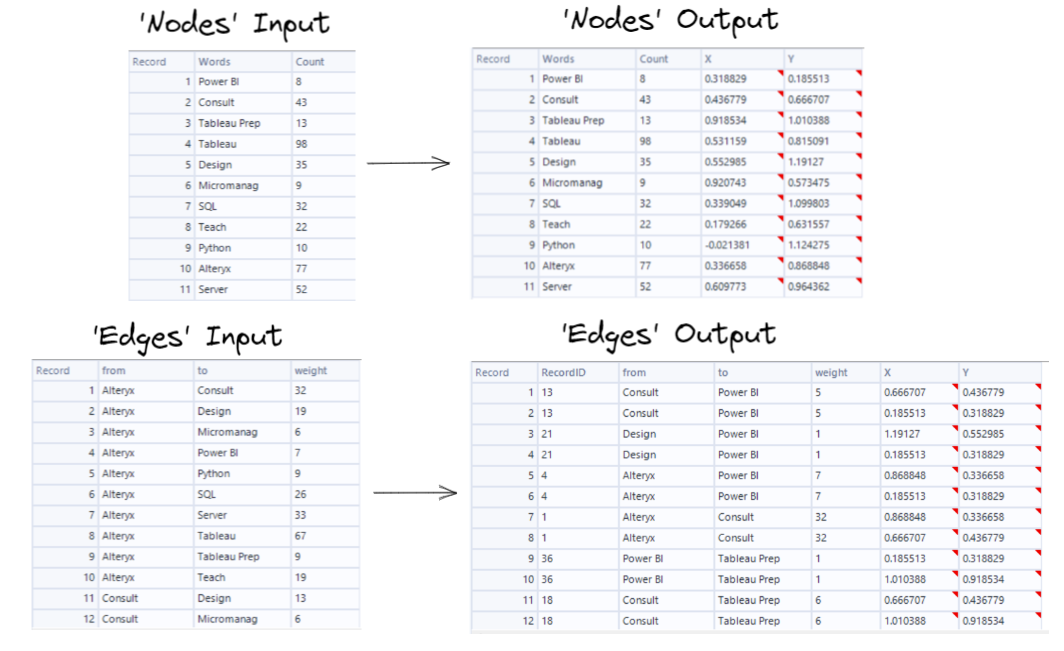
Many online tutorials recommend a graph-building software called Gephi, which I'm sure works great, but I wanted to be able to automate this process through Alteryx. To do this I built a macro that takes a 'nodes' input and an 'edges' input and generates co0rdinates for a network graph:
This is what the macro looks like:
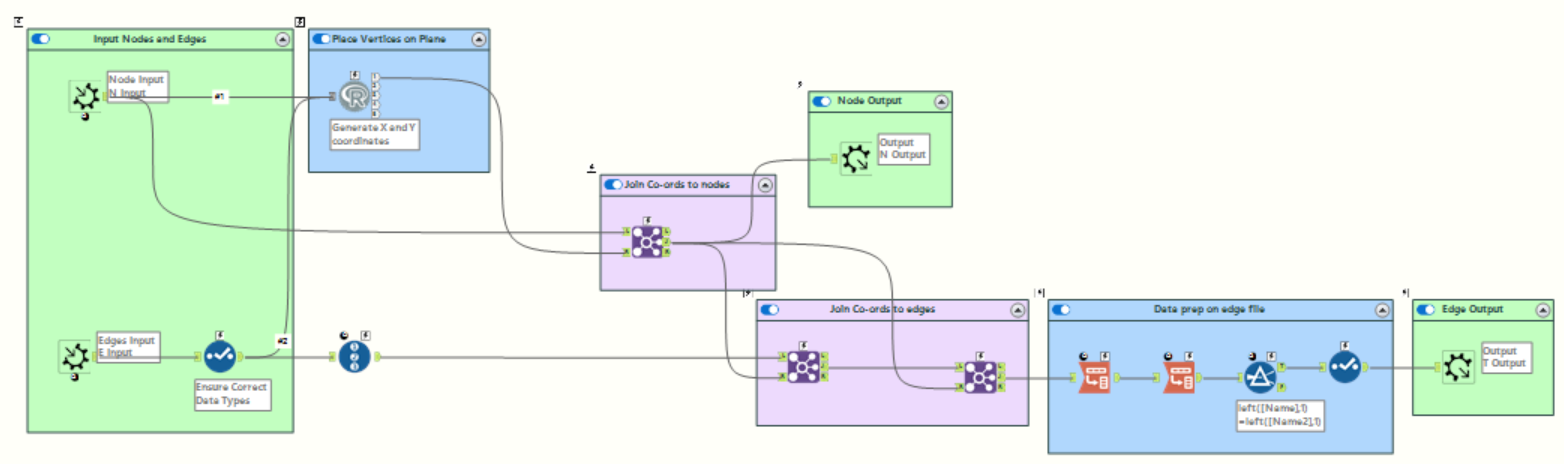
The only really important part of this macro is the 'R' tool - which uses an R package called "igraph" to generate the coordinates - so that's the part I'll go through in detail. The rest of the workflow joins the coordinates back to the inputs and puts it in the correct format for Tableau visualisation. Here's the R tool configuration:
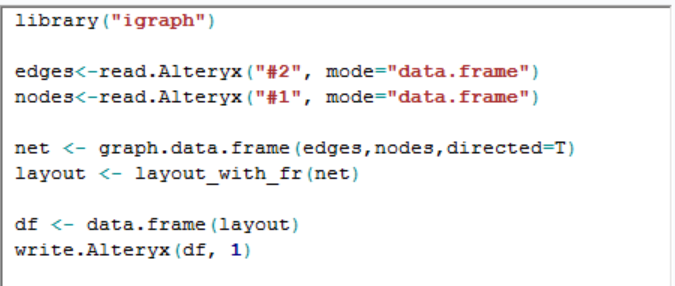
I'll go through this step-by-step:
library("igraph") - Loads the "igraph" package.
edges<-read.Alteryx("#2", mode="data.frame"), nodes<-read.Alteryx("#1", mode="data.frame") - Loads the data from inputs 1 and 2 into R as dataframes.
net<-graph.data.frame(edges,nodes,directed=T) - Generates an igraph graph object from the 'nodes' and 'edges' datasets.
layout<-layout_with_fr(net) - Uses the Fruchterman-Reingold layout algorithm to generate X and Y coordinates.
df<-data.frame(layout), write.Alteryx(df,1) - Outputs the coordinates to Alteryx.
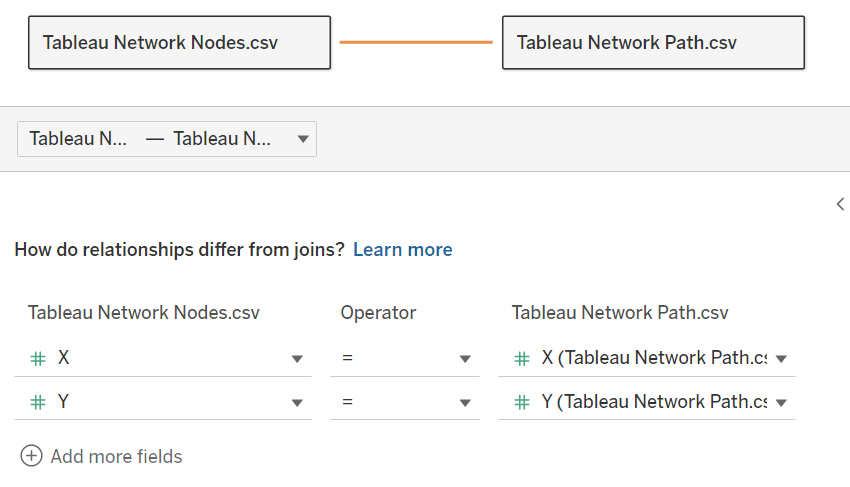
These coordinates can now be used to build the network graph in Alteryx. First, you need to relate your data in the data source tab:
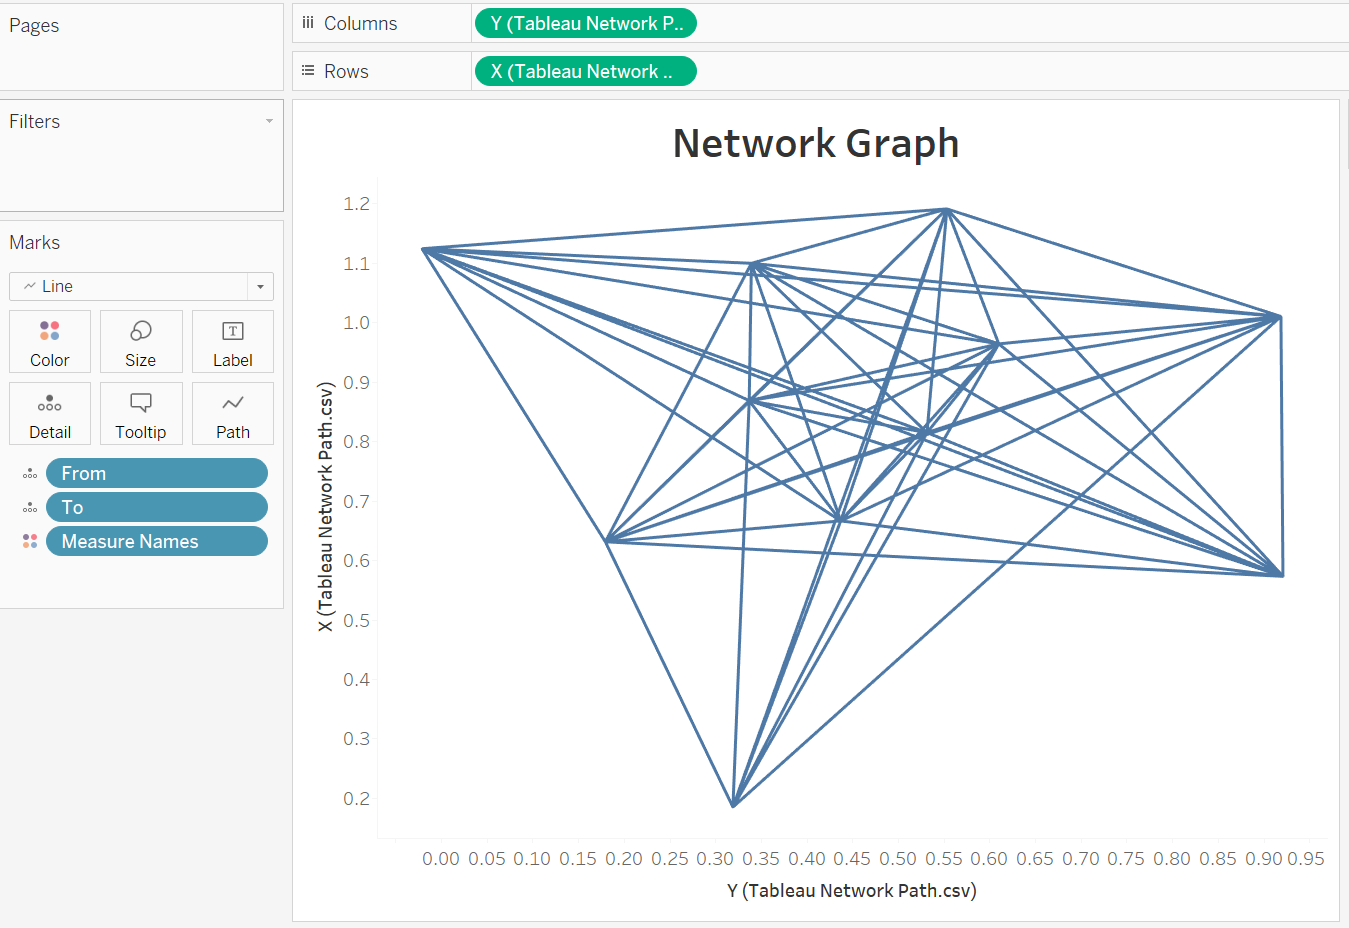
To start plotting the network graph, drag the X and Y coordinates from the 'edges' dataset onto columns and rows. Drag the 'from' and 'to' fields onto details. Change the marks type to a 'line'.
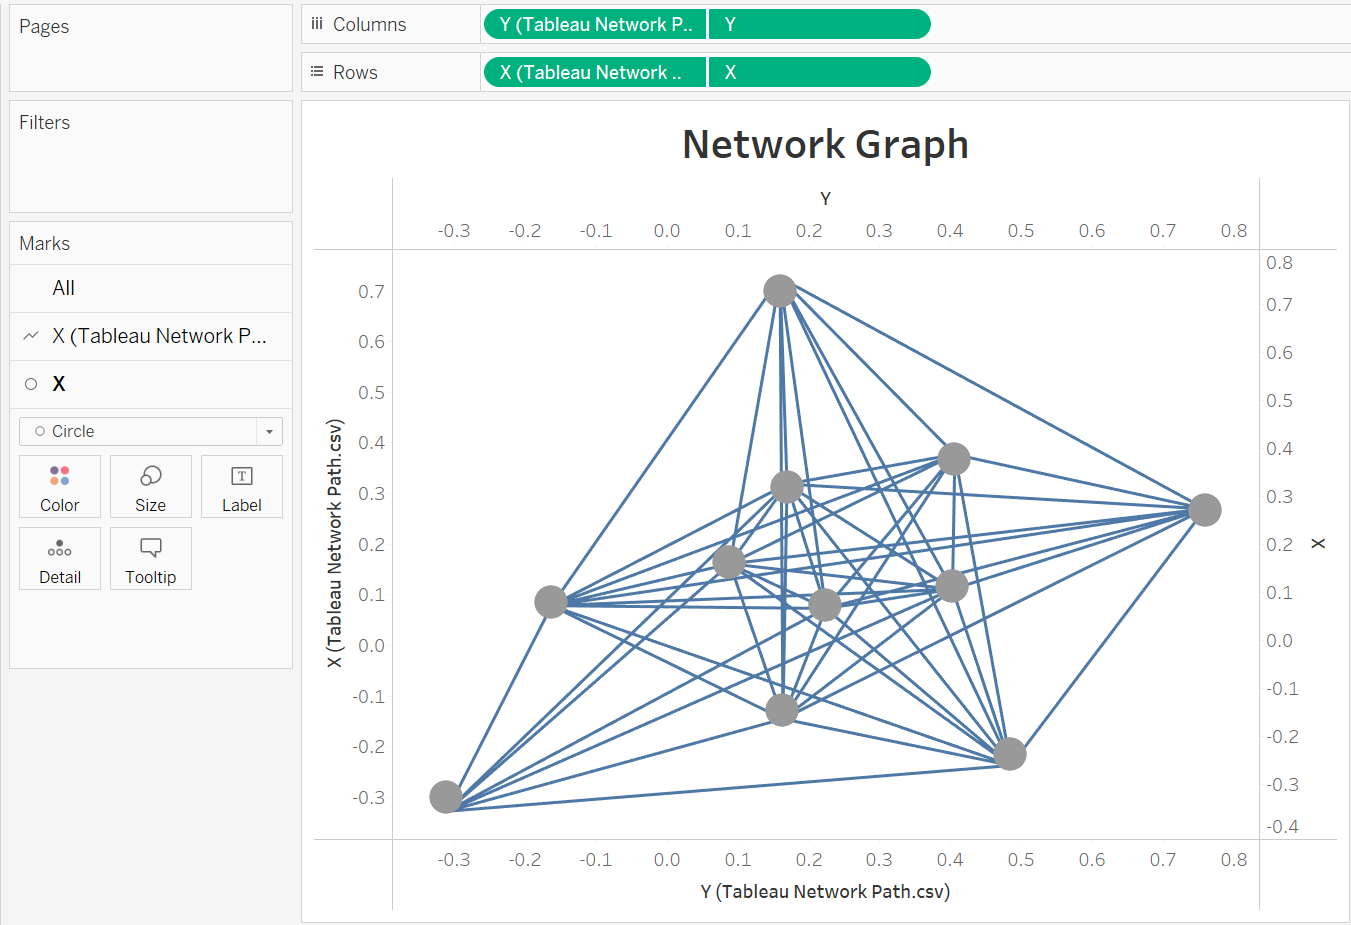
Create two dual axes with the X and Y coordinates from the 'nodes' dataset. Set the new marks card to "circle", and synchronize the axis.
You can then format your network graph. I got rid of the axis, added labels, and used my "weight" and "counts" field to change the size of my connections and nodes respectively:
Hopefully this was helpful. If you want to know anything else, or want to use the macro I made, feel free to get in touch.