Today we had another twist, we were to present our dashboards as if we were in our second interviews to get into the data school, This is because we were working on a dataset that had previously been used for DSNY application dashboards, but instead of having a week to create it, we had 6 hours.
The data was on the show survivor which I have never seen and this made understanding the data even harder, because we had so little time to create something we couldn't afford to have an extended data discovery period, which would have been very helpful as a lot of the columns referring to challenges and voting made no sense to someone who doesn't understand the show.
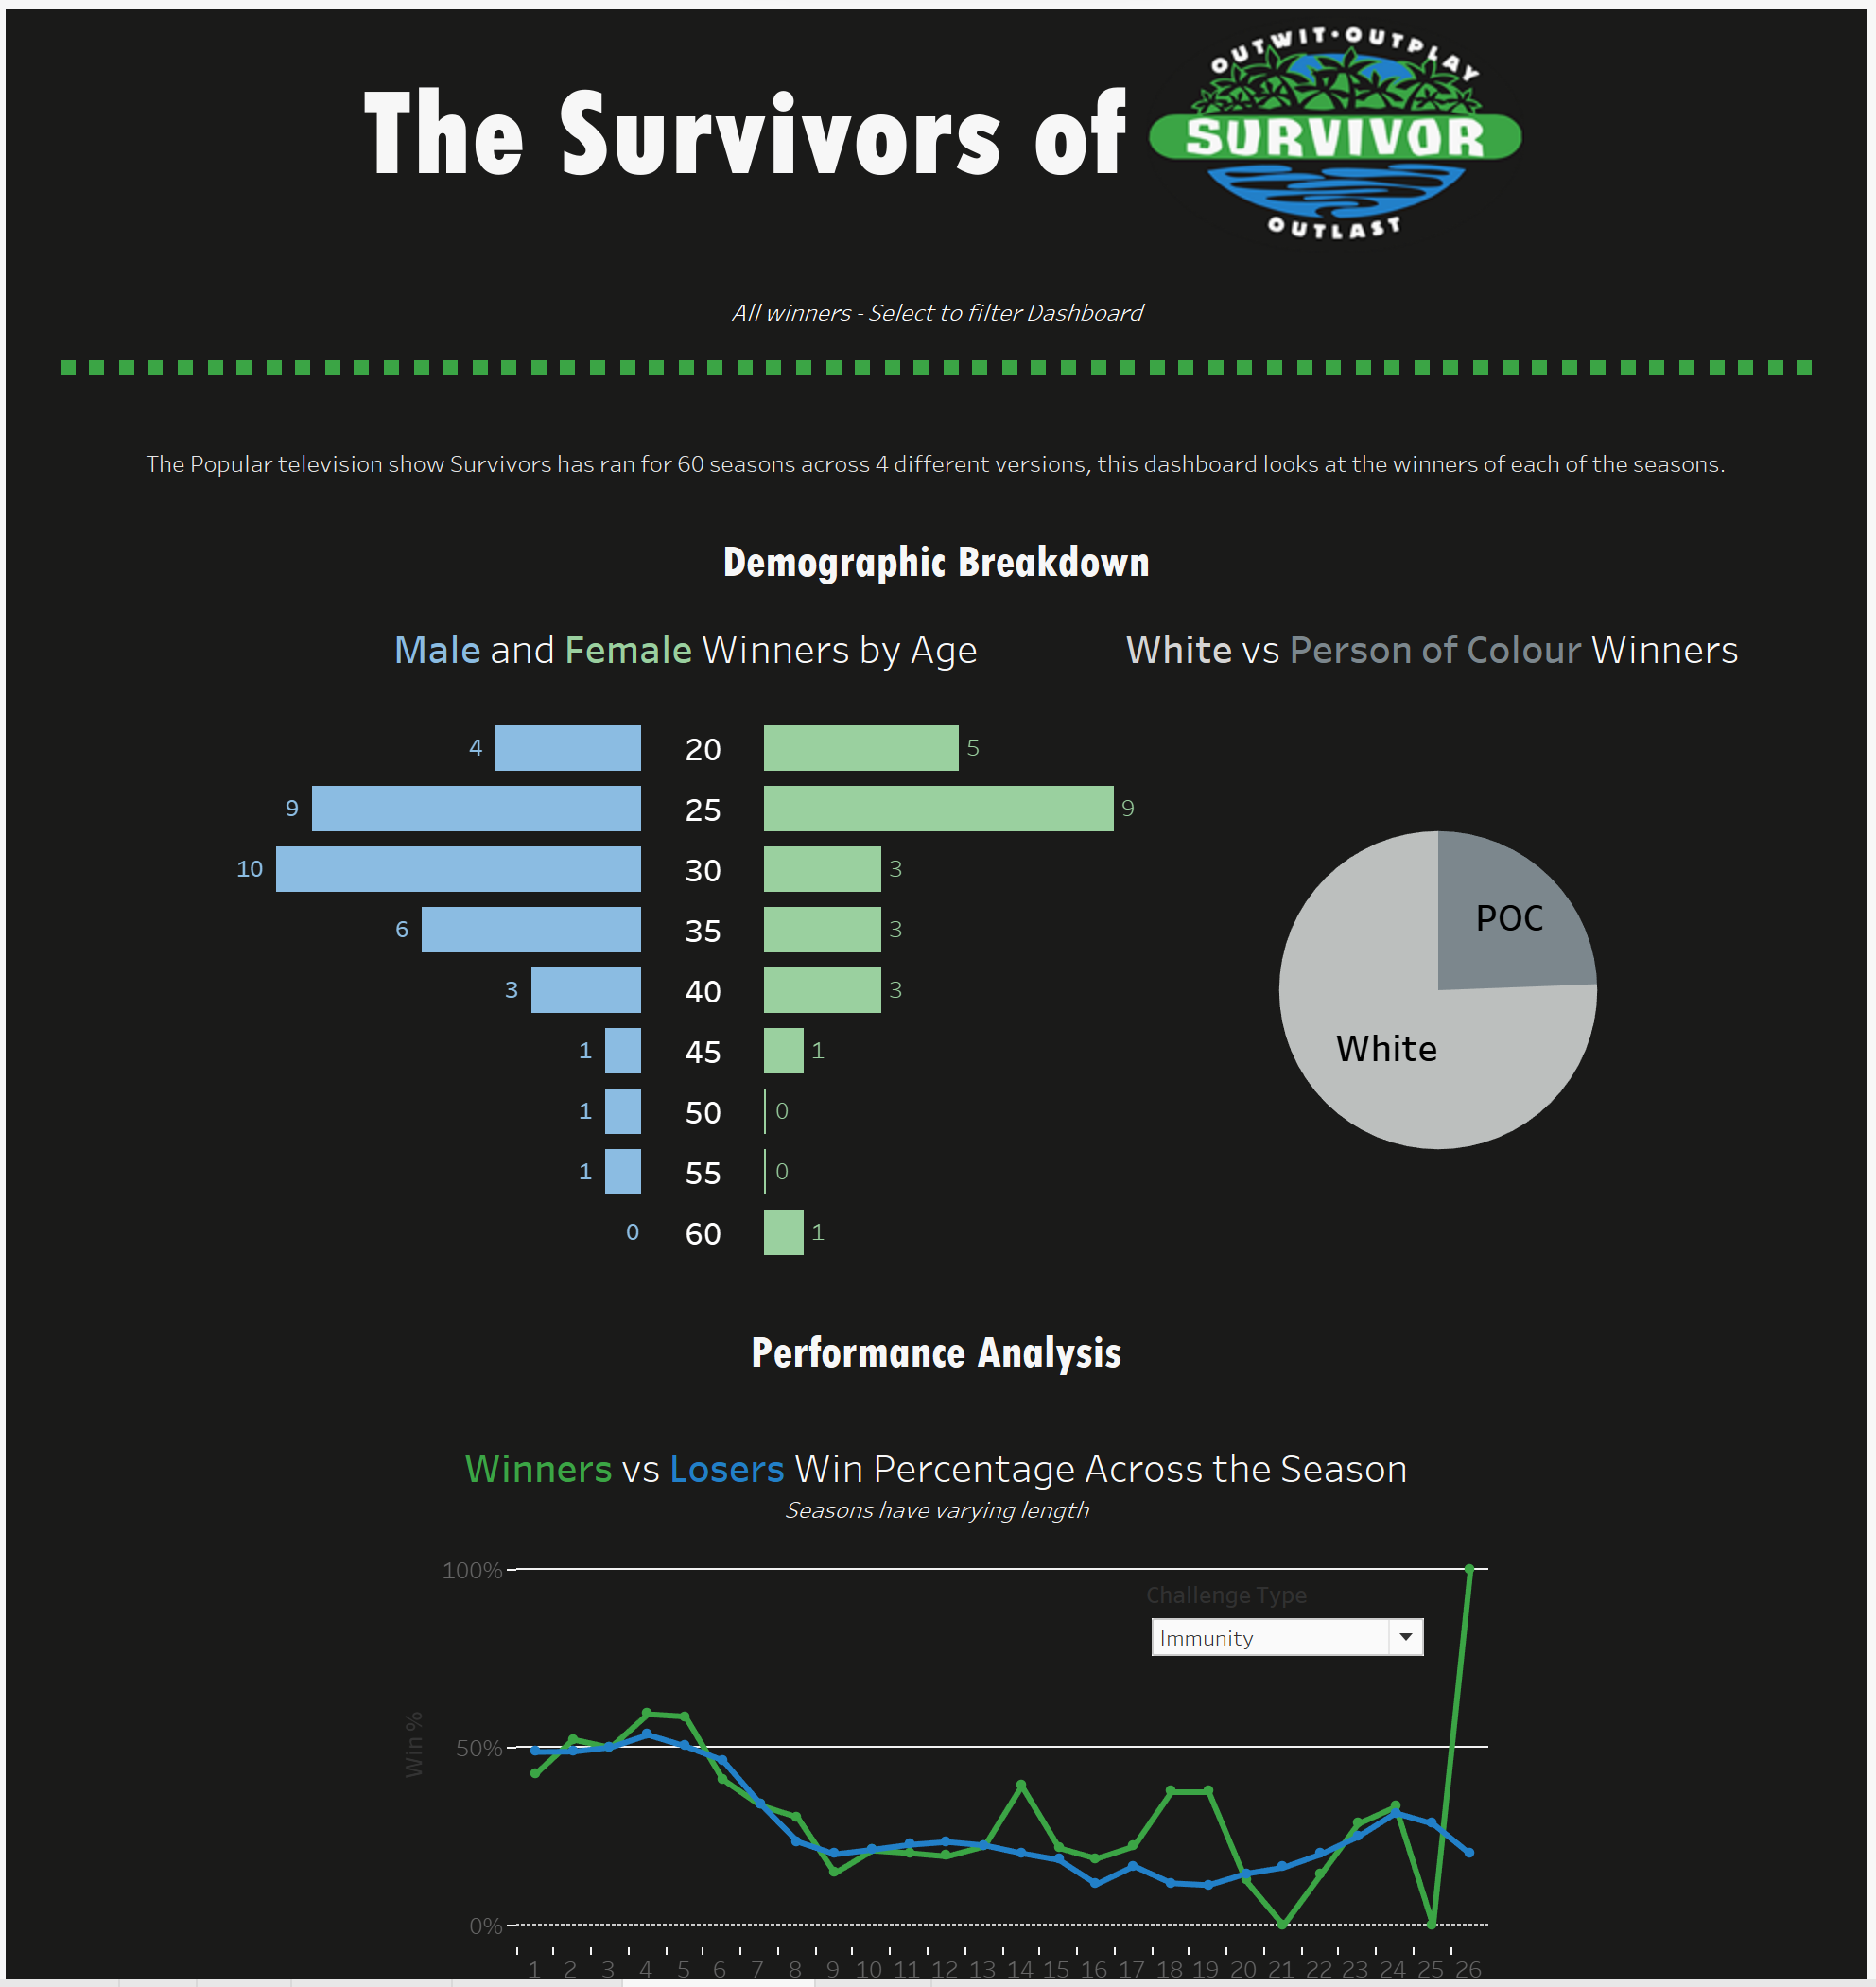
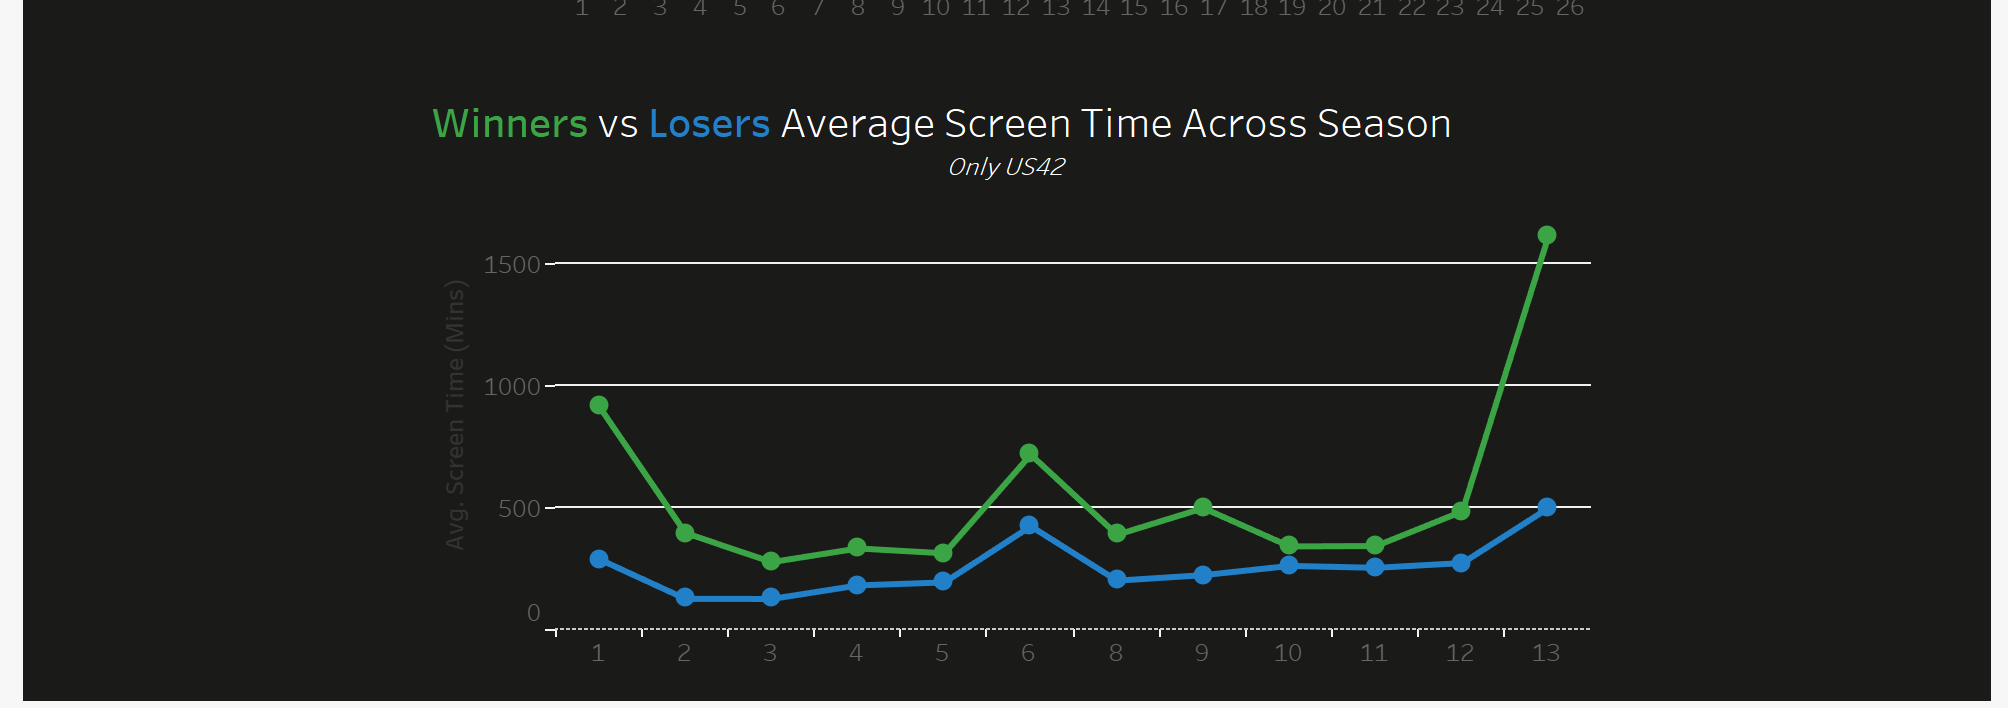
I decided to use 4 of the available data sets because I wanted to analyze things like win percentage and on screen time, this took much longer than expected to understand the additional charts. My plan was to create a dash looking at the winners of the show to see what demographics they were and what their win % and on screen time looked like over the course of a season.
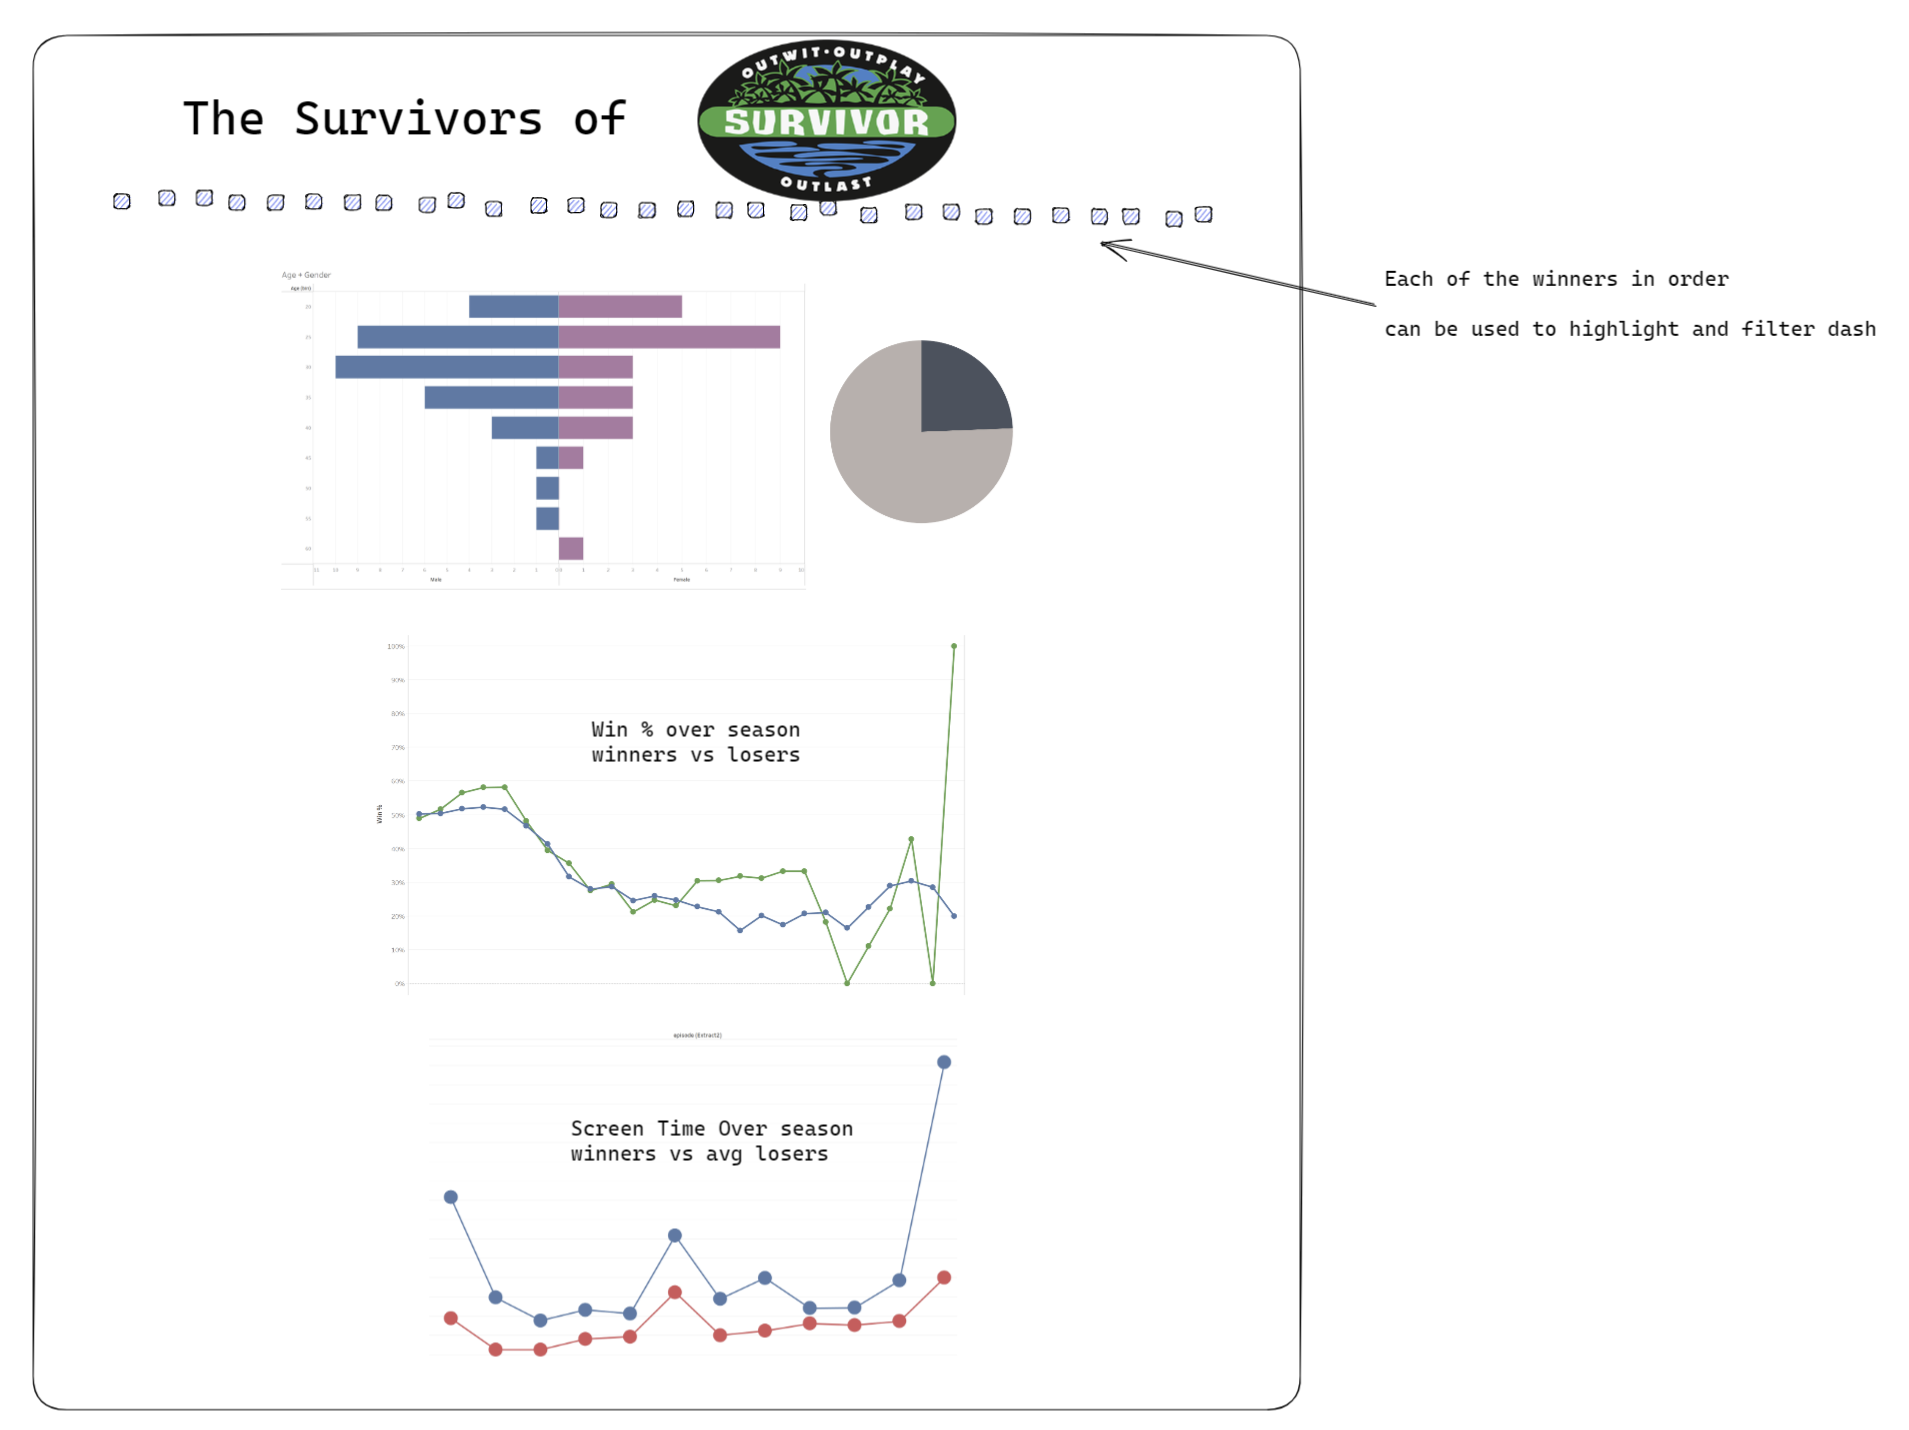
I had visions for the useability of the dash but because of the way the data was structured the interactivity was harder than expected to achieve, the rest of the charts were not too bad to make but because we had to make something of interview quality A lot of time was spent on the design and layout.