Today was day 4 our the final week of training at The Data School, known as The Dashboard Week. We were asked to put together a KPI dashboard with exceptional design. The dataset we had to analyse included data for the rental properties in San Francisco, USA from 1998 to 2018.
I started with data exploration. After seeing what data I have, I decided to prepare a KPI dashboard which could be used by property management experts. The dashboard is to provide information about the average yearly price for all the properties or a property in for an area of the user’s choice.
I looked at adding additional data to see any relationship between the price of the property and transport links but I decided against it due to the limited time I had for this project.
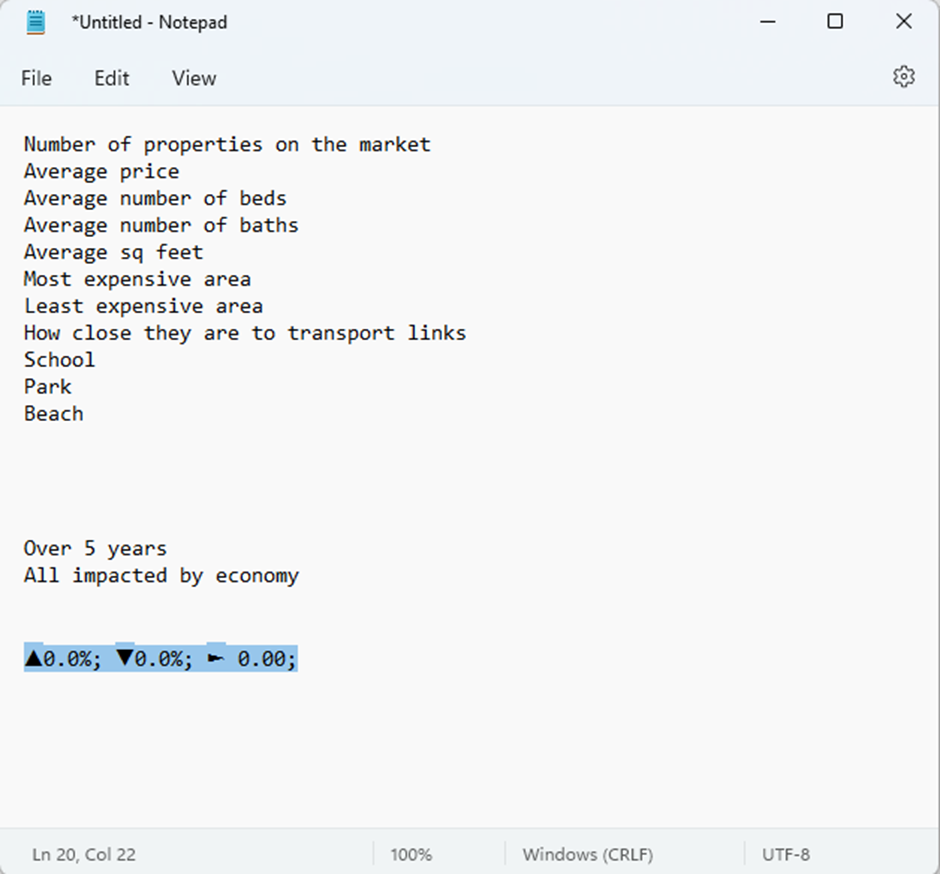
After having a good understanding of the data I when ahead to make a list of the questions I could try to find answers for. Here is a copy of my notepad:
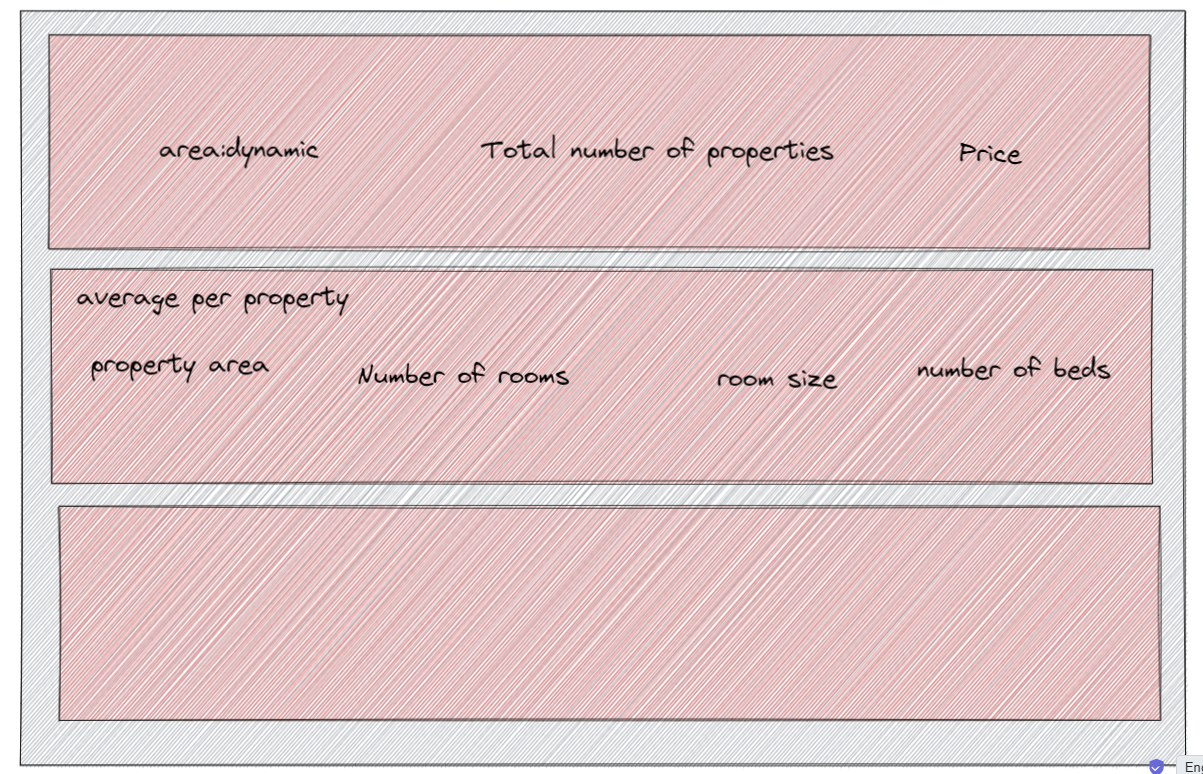
Then I made a very quick draft on escalidraw:
After a couple of hours I ended up with this dashboard:
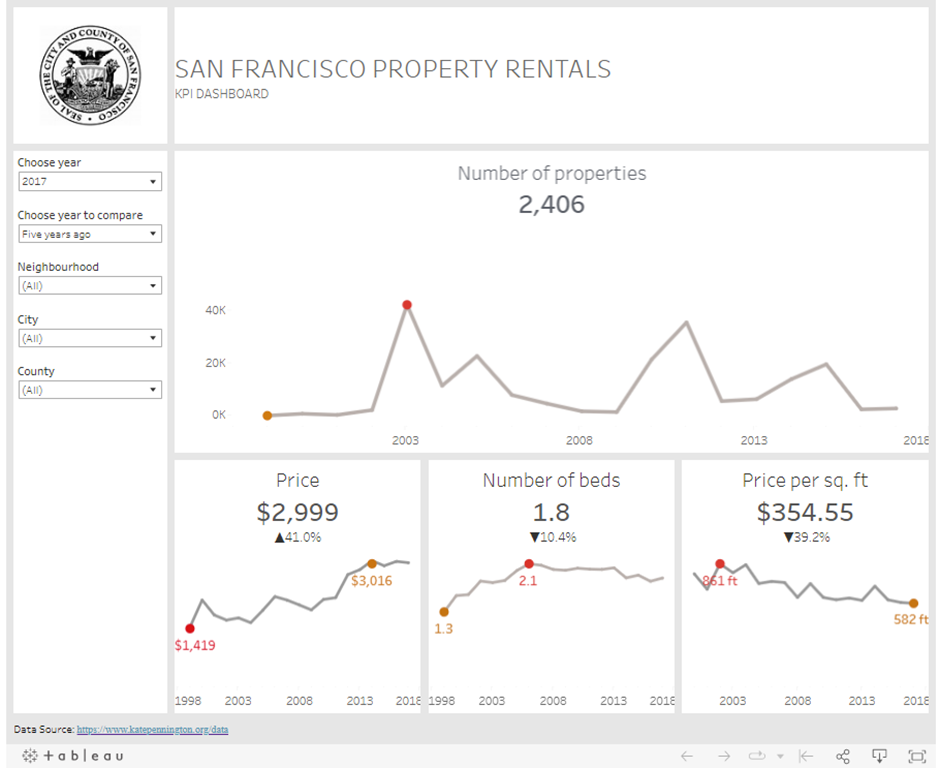
The main part of the dashboard shows the number of properties available over the period. I have highlighted the minimum and maximum values.
Underneath I have included three KPI cards, one for the average price, one for the average number of beds and one for the price per 1000 sq. ft. Underneath the big number I have included the change from the previous one year, two year, 5 year or 10 year. Filter for selecting this period is available in the filters section on the left.
This concludes my dashboard for today.
One more day and my training at The Data School is over!