A while ago I wrote a blog about how to create a heatmap in Alteryx and visualize it in Tableau. This week, continuing with the spatial theme in Alteryx, I’m going to show you the usage of a couple of other spatial tools in Alteryx, namely Poly – Split, Spatial Info, Buffer, and Spatial Match. Let’s get started :D
I have a Dataset about analyzing Houston Areas and potentially flooded areas along with 5 small tasks as followed:
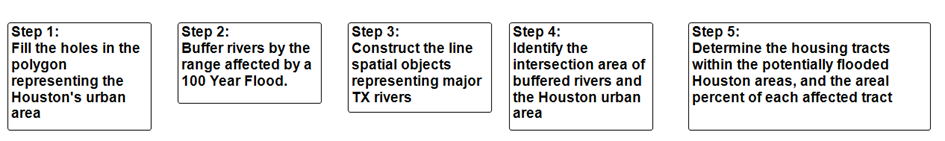
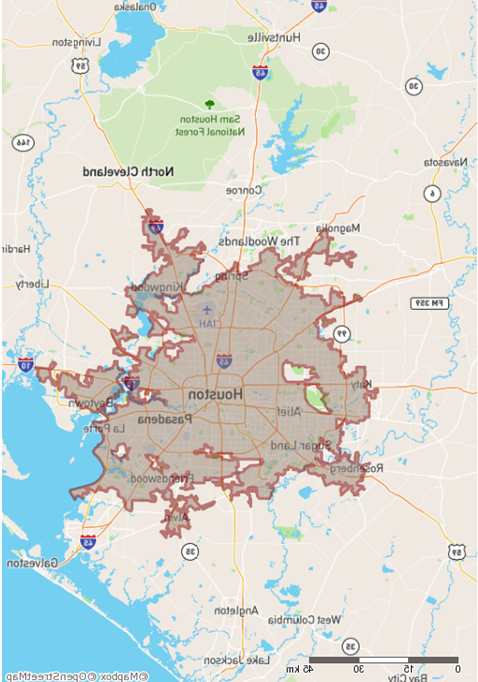
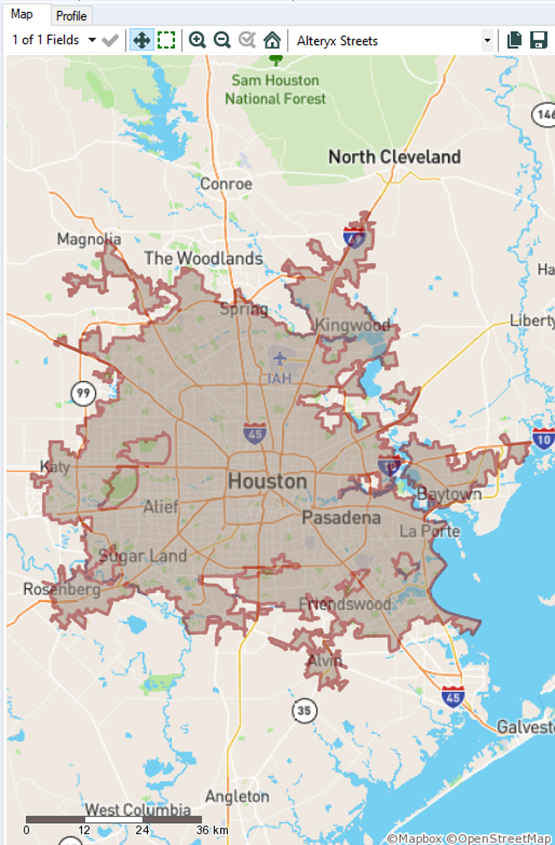
Step 1: Fill the holes in the polygon representing the Houston’ urban area.
Below is the area map of Houston with holes within the region.
Now there are a couple of ways to tackle this task but the easiest way is to use Poly-Split tool.

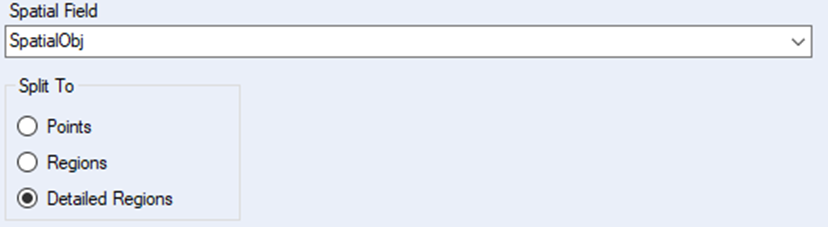
Just click on the option Detailed Regions, Alteryx is going to identify the detailed areas in this region including mainland and areas not covered in the file but bordered within this whole region (holes).
The next step is to use Sumarize tool to combine those identified areas.
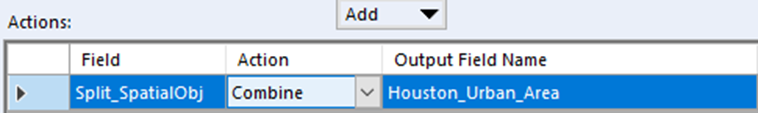
The end result would look like this:
Step 2: Buffer rivers by the range affected by a 100 Year Flood.
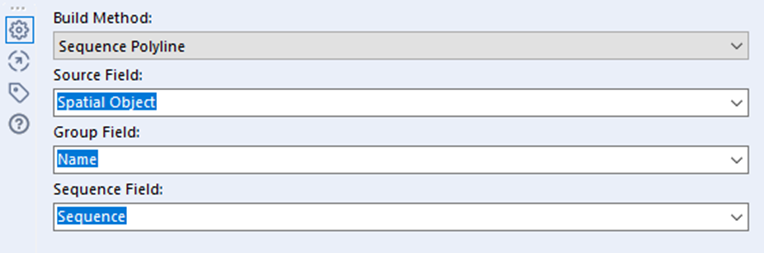
Unlike task 1, in the original dataset there are spatial object points constructing the rivers this time. What we need to do is to build lines out of those points. How? Use Poly-Build tool.
Remember to select group field by Name and Sequence Field by Sequence.

After that we got this:
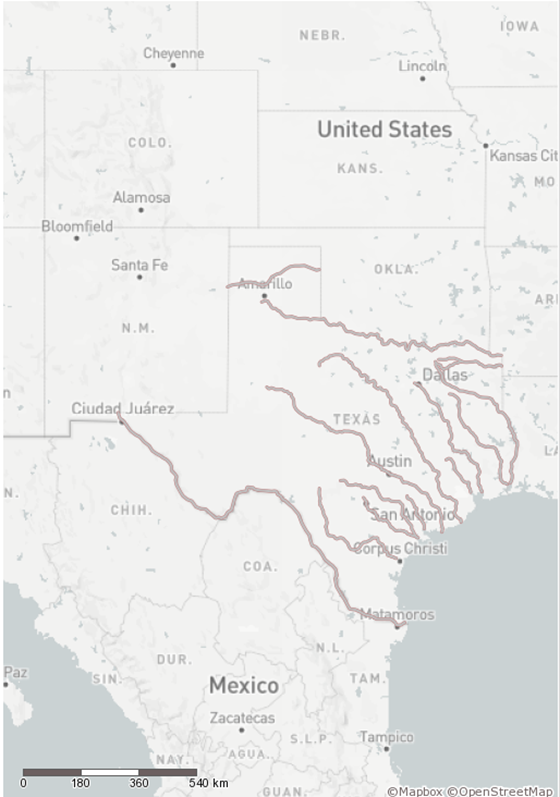
This is also the requirement of step 3, which is construct the line spatial objects representing major TY rivers.
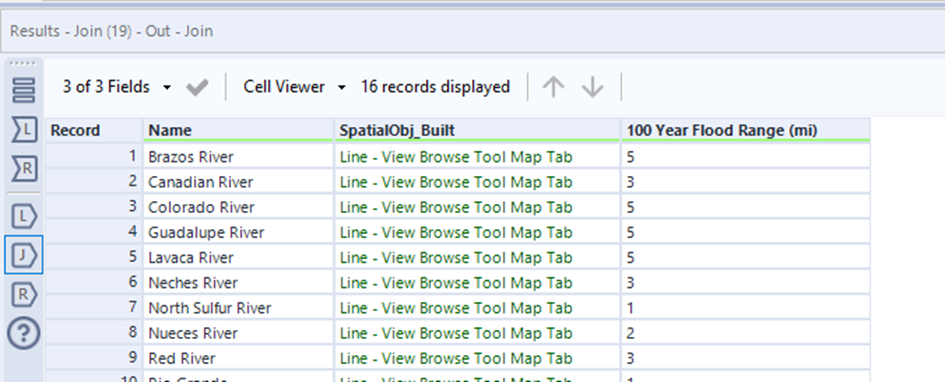
Because this tool only return the name of the river and the spatial line as the output, you want to consider grouping by the River Name and 100 Year Flood Range. Thus, use summarize tools then join them with the spatial line created to get this result:
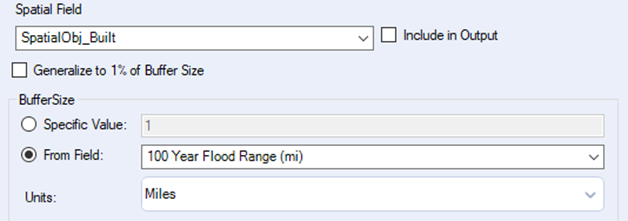
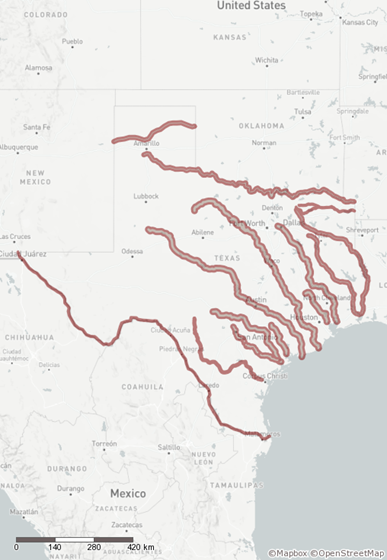
The next step is to use buffer tool, whose usage is to take any polygon or polyline spatial object and expand or contract its extents by a user-specified value. Now we want to visualize the flooded area which are located within 5 miles from the river.

Here is our final output:
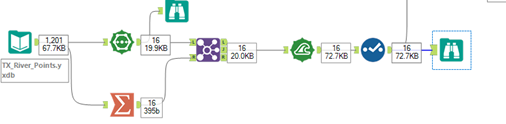
This is the workflow for this task:
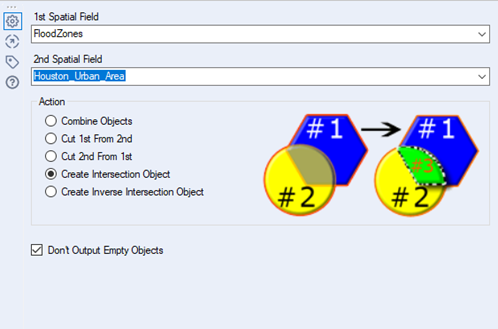
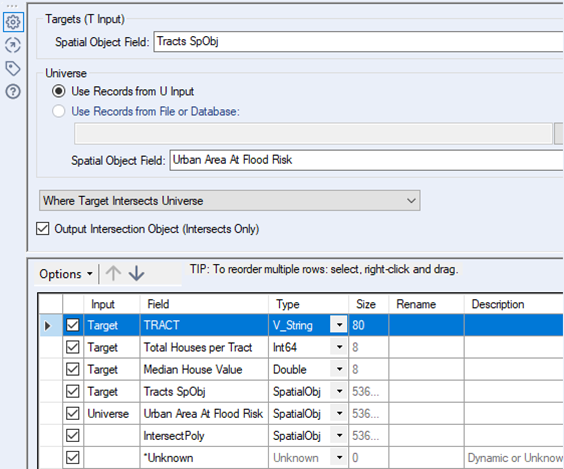
Step 4: Identify the intersection area of buffered rivers and the Houston urban area.
You would need to configure the Spatial Process tool to solve this task. First let’s append the Houston urban area in Step 1 with the buffered rivers in Step 2.

After that the intersected area can be combined and grouped by rivers, using summarize tool. Then we got the following output:
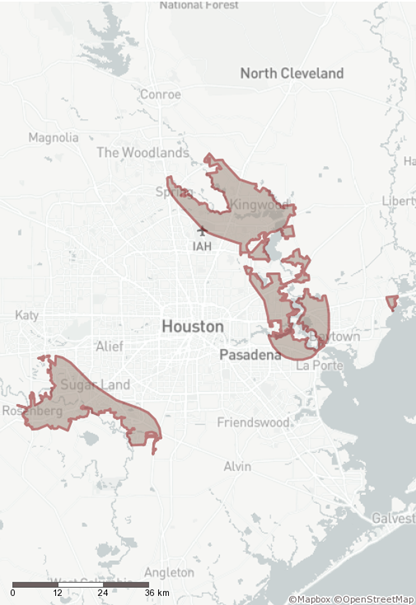
Step 5: Determine the housing trats within the potentially flooded Houston areas, and the area percent of each affected tract.

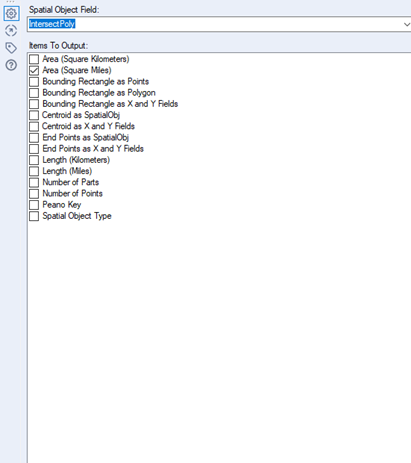
Then You need to compute the area in Square miles of intersected area by using the Spatial Info tool.
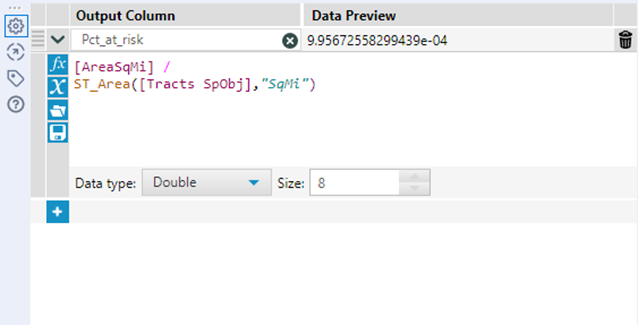
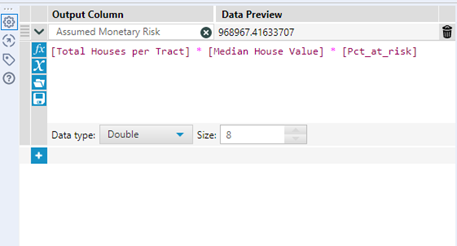
After that, you need to calculate the percent at risk for each area and the Assumed monetary risk.
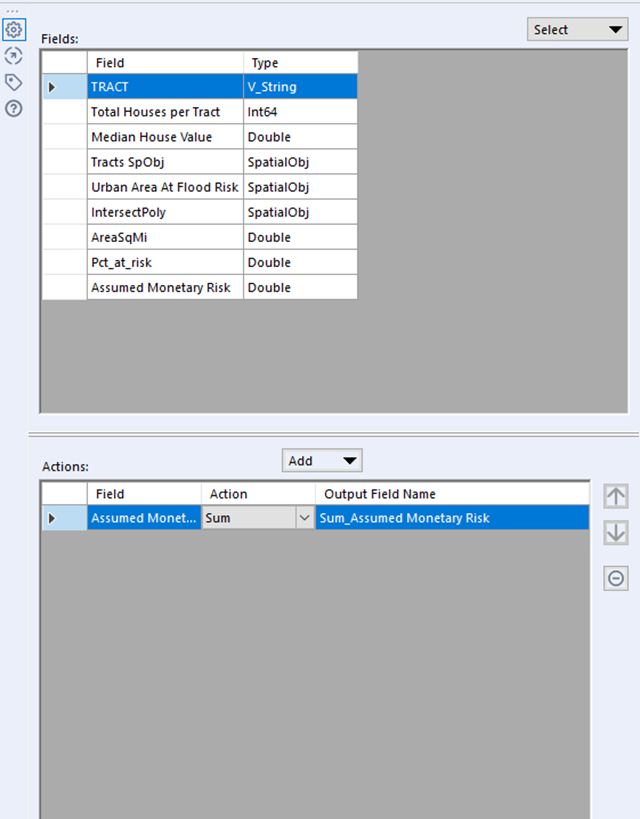
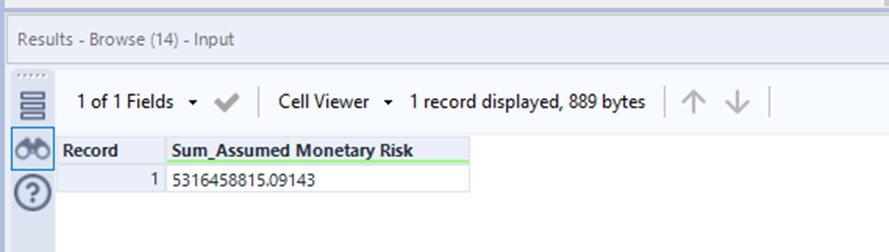
Last but not least, don’t forget to take the sum of the assumed monetary risk.
That is the end of task 5. Stay tuned for what’s coming up!