


A tile map is a type of map you may well have come across on tableau public. A tile map turns each region in the map into the same dimensions. For example, a US tile map may turn each state into a hexagon of equal dimensions. And this blog will cover one way of creating tile maps.
It may be tempting to use tile maps liberally where possible but really it should be used like any other chart, with consideration for its specific use case. For a map where the user may need to know the area of of each region, a tile map will not be suitable. As it standardizes the size of each region.
But for a purpose where the size of a region does not come into play, a tile map may be more suitable. For example, election results can often be a good use case for tile maps. This is because the size of a region can be misleading to the user who may think more votes are cast in that area. For example, rural areas can often appear large on a map, but have a low population density and therefore less votes will be cast in this area compared to a city which could take up less area on a map.
To create a tile map in tableau, we will be needing additional spatial data brought in. The spatial data brought in can be found from this blog writtten by a 5 time tableau zen master, Joshua Milligan: Hex Map Spatial File | VizPainter
With the direct file download link here: https://vizpainter.com/wp-content/uploads/HexStates.zip
The spatial data creates a hexagon shape for each state in the United States. And to use this, we then have to join this to the state based data in our data set of choice; which for the purposes of this blog will be the much loved, sample superstore dataset provided by Tableau. We then have to use a physical join to combine the two data sets and allow us to bring in the tile map into our visualization, as tableau does not allow us to use relationships to bring in our hex map.
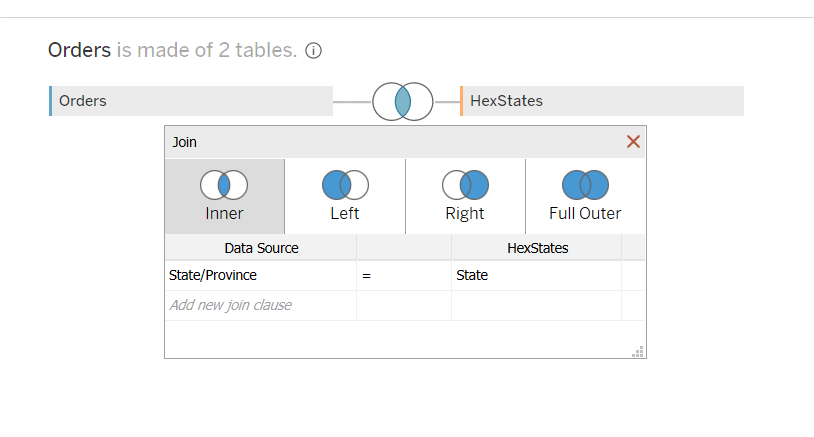
We select inner join to join the two common fields, state/province to state. This results in each state of the USA having a geometrical shape attached to it. And from this we can go ahead and generate our hex map by double clicking on Geometry:
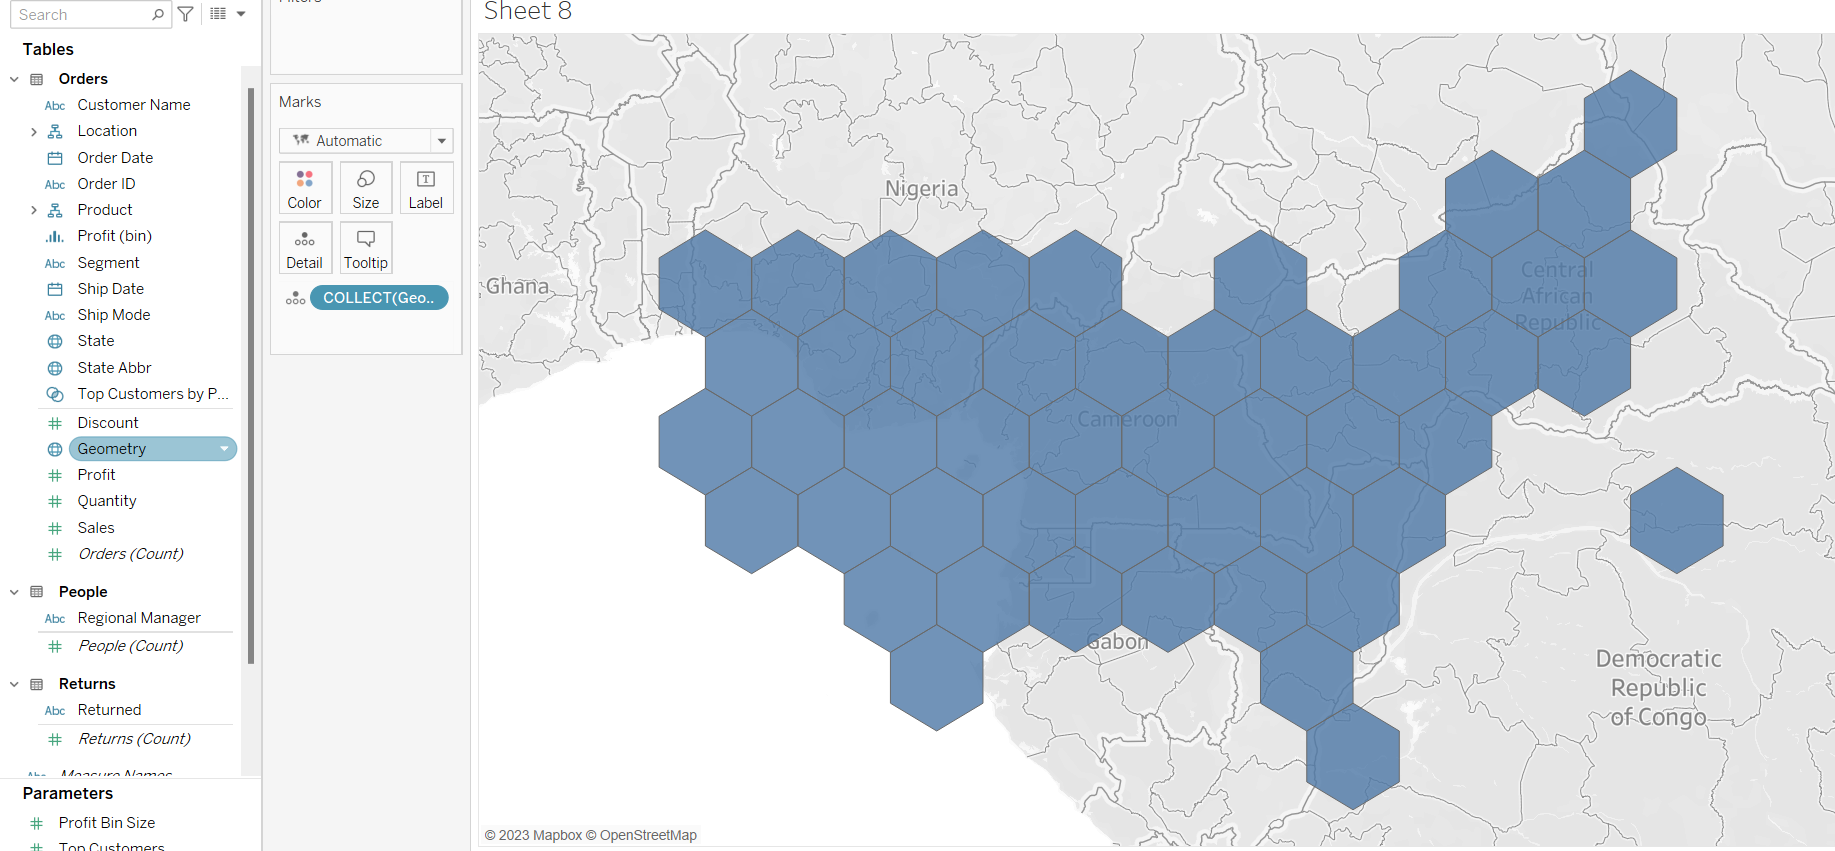
The hexagons will be placed over cameroon roughly as each shape had a geometrical property attached to it when created by its owner; who for some reason opted to settle on the country of Cameroon. We can set washout to 100% to remove the background layer of Africa. We do this by going to the map tab and then clicking background layers
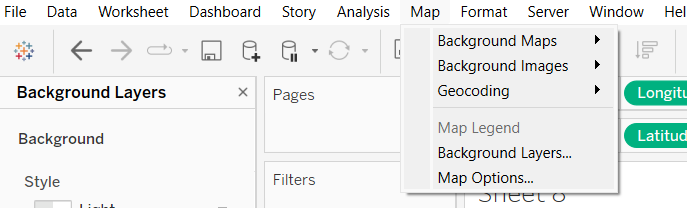
And then setting washout to 100%:

We can then use this hex map and start vizzing in the same way we would use a regular map in tableau:
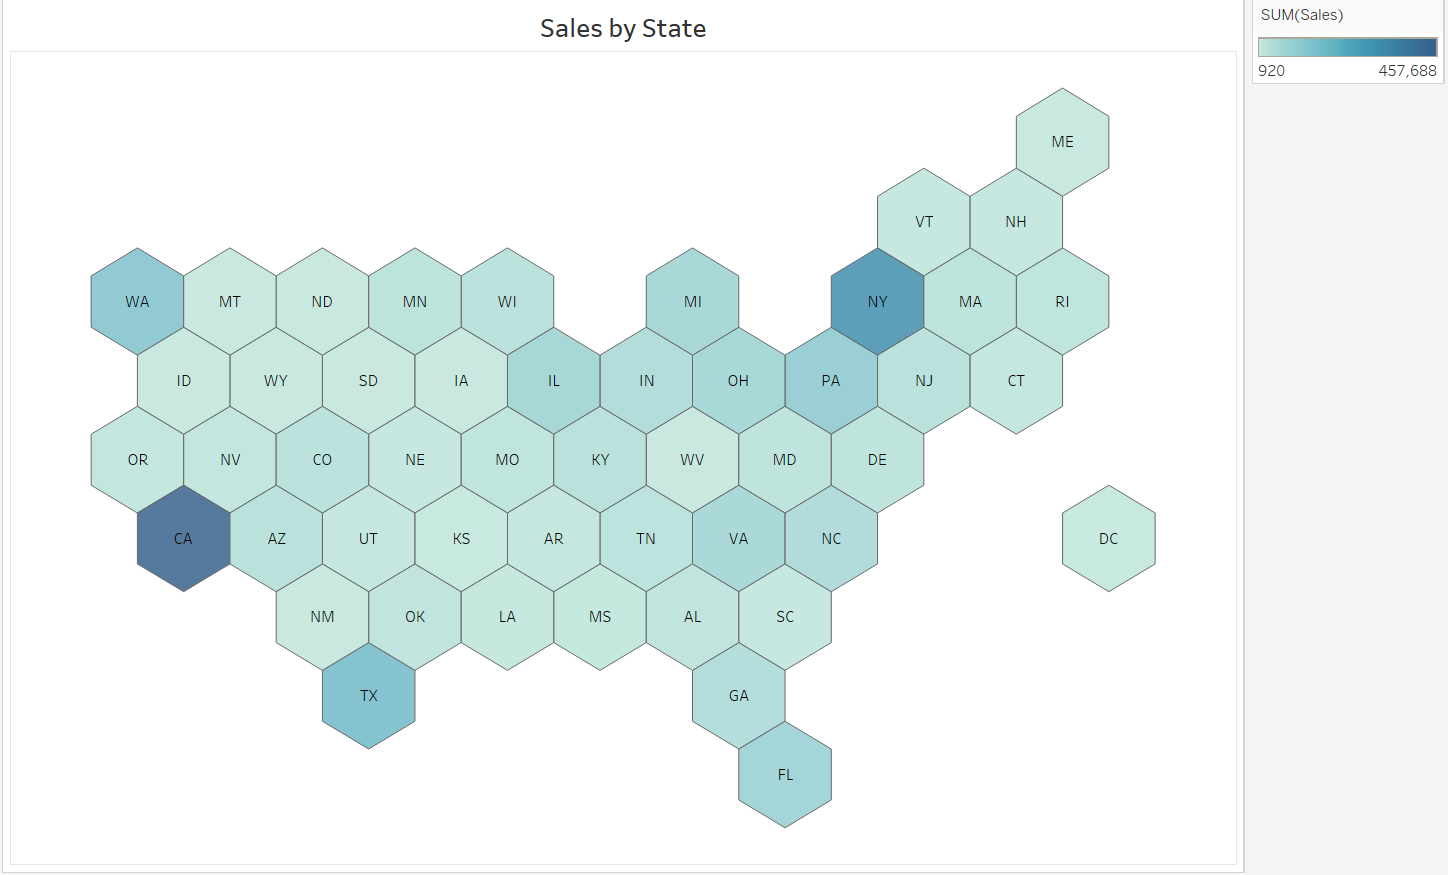
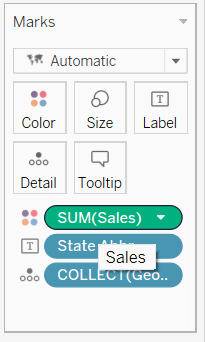
Note, if we do not break down the tile map by any further detail, tableau will by default 'collect' them and it will be one large shape. As opposed to 50 different hexagons. We can break this map down by adding state abbr to label, or state/province to detail.
Tile Maps when used correctly can be a great way to visualise your data but take to not use them too liberally!