In Tableau, one can synchronize axes created in the same sheet with a couple of clicks. Sometimes one has to confront situations where the axes created in two different sheets needs to be synchronized. I had a similar situation during my placement. I was provided with an idea by our colleague Valerija Kirjackaja which I developed further. I thought to write this blog so that it could be helpful to others.
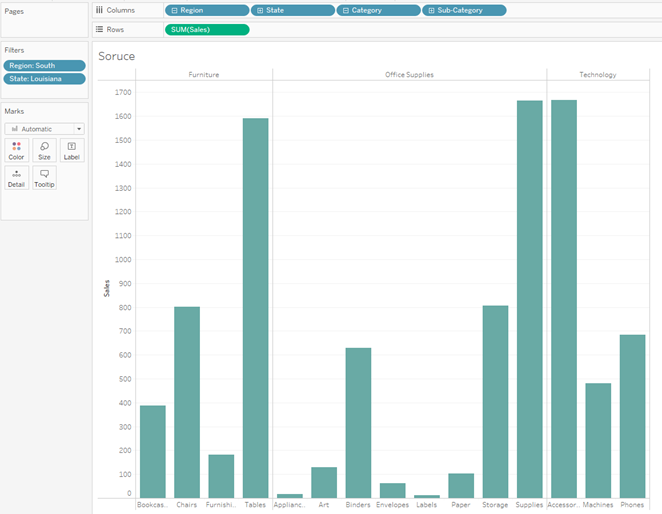
The Superstore dataset is used to explain this idea. The first step is to create the charts that need to be synchronized. To explain this, a simple bar chart is created. For that, the fields "Region", "State", "Category" and "Sub-Category" are added to the row shelf and the field "Sales" to the column shelf. To apply filter the fields "Region" and "State" are added to the filter area. The sheet is then named as "Source". The view would look as shown below.
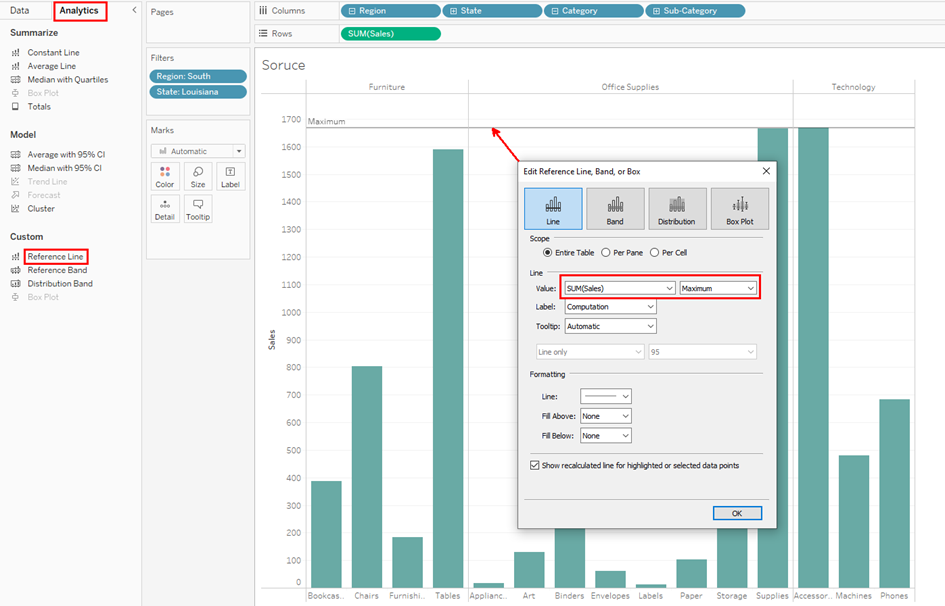
The next step is to add a reference line that will show the maximum value from the view. From the "Analytics" pane, "Reference Line" is dragged into the view, and the option "Table" is selected. This reference line will be later be updated through a parameter to synchronize the axes.
The second sheet is created by duplicating the first and renaming it to "Target". The color of the bar is changed so that it can be easily identified in the dashboard.
The Sync Button
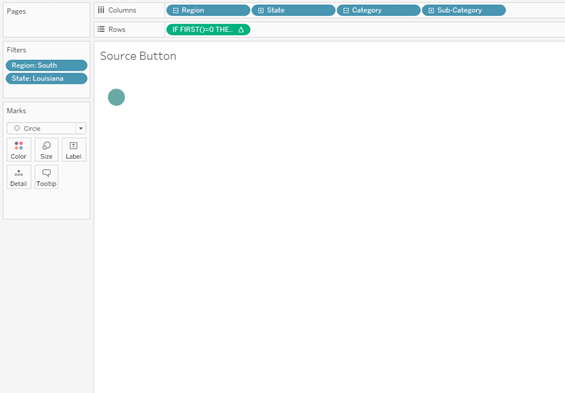
In this step two buttons, one each for "Source" and "Target" sheets are created. The axes of the charts can be synchronized by clicking these buttons. To create this the "Source" sheet is duplicated. The "Sales" field in the column shelf is then replaced with the below formula.
IF FIRST()=0 THEN WINDOW_MAX(SUM([Sales])) END
The function WINDOW_MAX(SUM([Sales])) calculates the maximum value for the corresponding view. The function FIRST() returns the first row in the partition. Effectively the formula would position the maximum value of the view in the first position.
Now on the area "Marks", the type of the chart is changed to "Circle". The Header is hidden and using formatting all the lines are removed. The sheet is then renamed as "Source Button". The view should look like the one below.
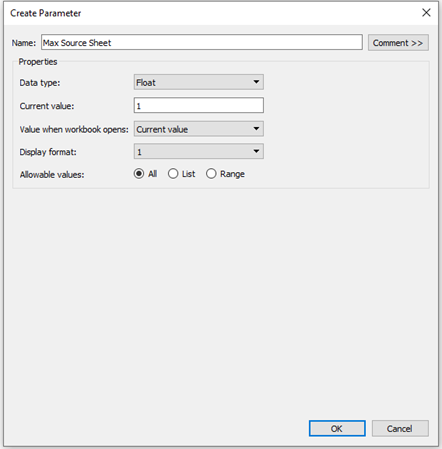
By repeating the above steps the second button for the target sheet is created and is then renamed as "Target Button". The color of the circle is modified accordingly. The next step consists of creating parameters that will save the respective maximum value of the "Source" and "Target" sheets. That means when the button is clicked, the maximum value of the corresponding sheet would get saved. The parameters are named "Max Source Sheet" and "Max Target Sheet" respectively.
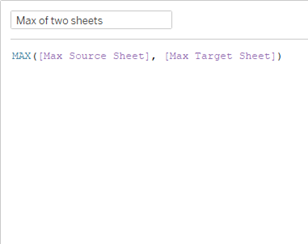
A calculated field "Max of two sheets" is now created to save the maximum value from these parameters. Later, this value is used to control the reference line which in turn would synchronize the axes.
Adapting the Reference line

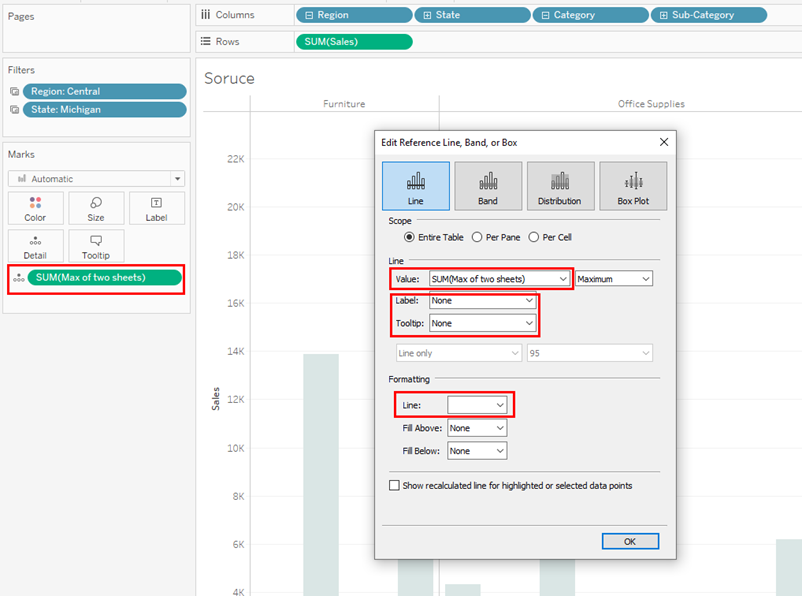
The reference line of each sheet needs to be modified such that it would adapt based on the calculated field "Max of two sheets". Also, this line needs to be hidden on the chart. For this the "Line" in formatting is changed to the color white. Also, the Label and Tooltip are changed to "None" so that they will not be visible when the mouse is being hovered on the line.
The Dashboard
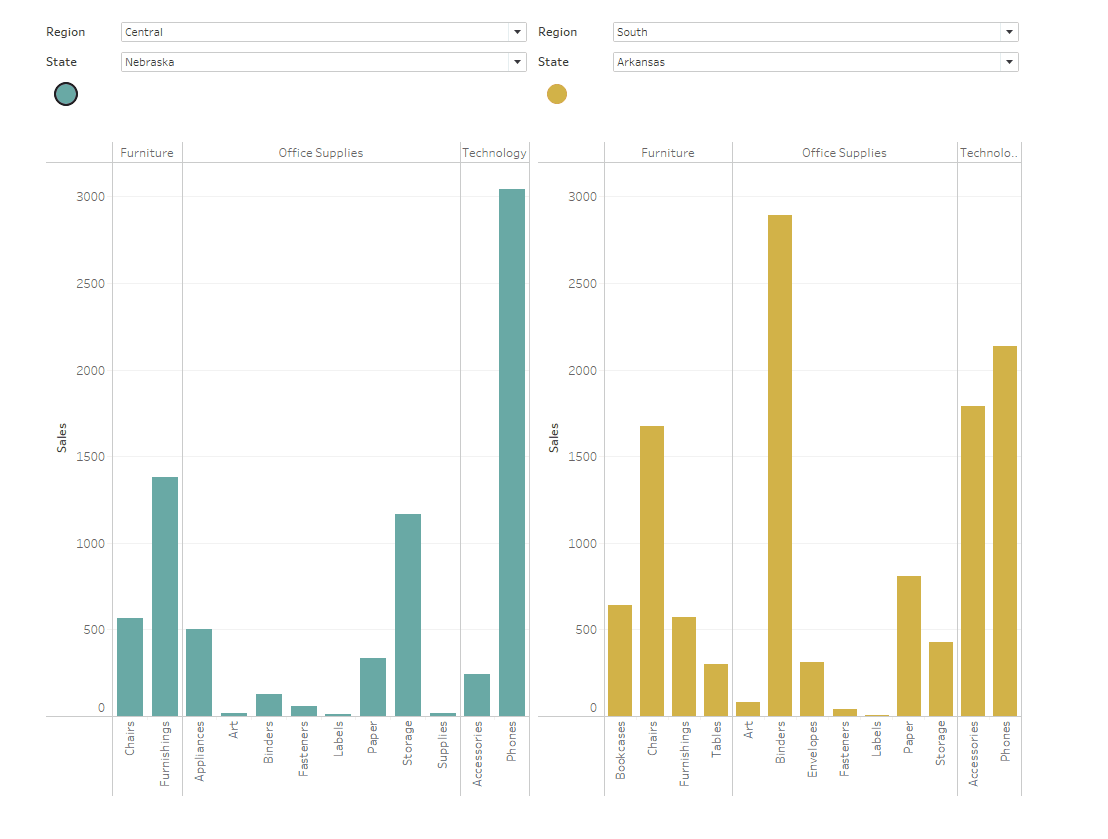
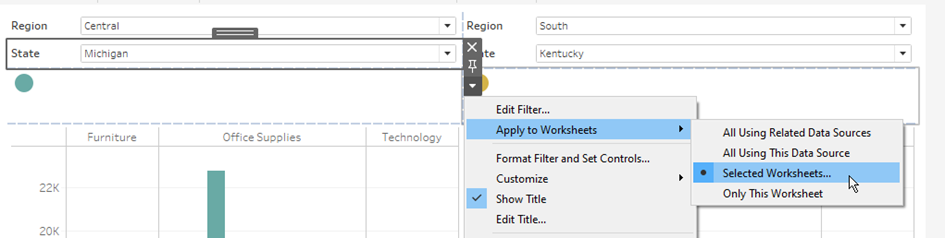
The dashboard is then created by adding all the sheets and the corresponding filters. On the left side of the dashboard are the "Source" sheet, the "Source Button" sheet, and the corresponding filters added, and on the right side of the dashboard, all that belongs to the "Target" are added as shown below.

Also, ensure that the filters are applied to filter the respective charts.
The Parameter Action
By using the parameter action the axes can be synchronized. For this, two parameters one for each button are created. The below steps illustrate how to create the parameter action.
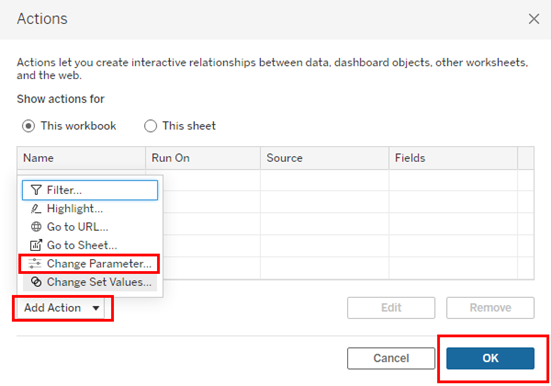
· From Dashboard > Actions is selected.
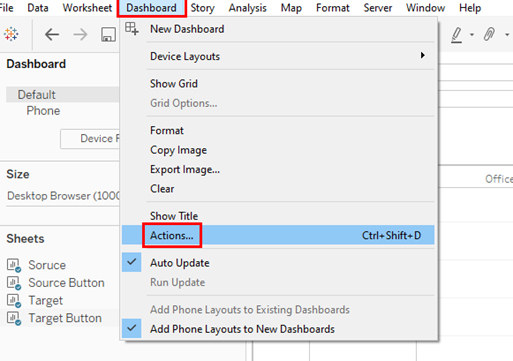
· From the Add Action, Change Parameter is selected and OK is clicked.
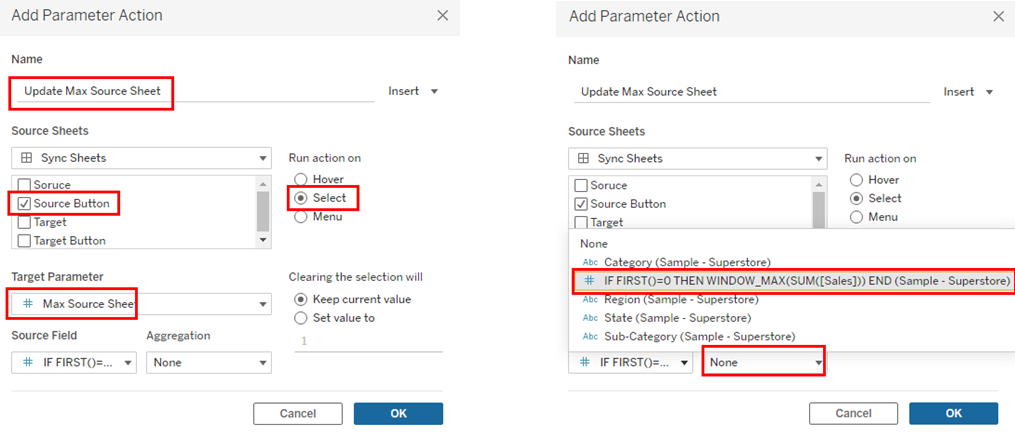
· A meaningful name is given for the action.
· As Source Sheets "Source Button" is selected.
· As Target Parameter "Max Source Sheet" is selected. The Option "Select" is as Run action on selected.
· From the Source Field the formula selected, which was used to create "Source Button".
· From Aggregation "None" is selected and OK is clicked.
The above steps are repeated to create the second parameter action for the "Target Button".
The dashboard is ready with the functionality we wanted. This can be verified by applying the filters on the charts and clicking the buttons.
