The task is to create a data visualization (viz) for the Data + Movies challenge by Tableau within two days. The challenge involves using a provided data source and data dictionary to create a viz related to movies. Each team member must choose a different story to focus on, such as a specific actor's career, a director's career, a studio, a particular genre of film, or comparisons between actors, directors, studios, or genres.
Plan:
- Understand the Challenge: Review the provided Challenge Starter Kit to understand the requirements, data source, and data dictionary. Ensure clarity on the scope and objectives of the challenge.
- Choose a Story: Select a specific focus area from the suggested ideas or brainstorm for alternative topics that align with personal interests and data availability. Consider factors like data quality, relevance, and potential for interesting insights.
- Explore the Data: Dive into the provided data source and data dictionary to understand the available datasets, variables, and relationships. Identify key metrics, dimensions, and patterns that can support the chosen story.
- Data Preparation: Cleanse and prepare the data as needed for visualization. This may involve handling missing values, formatting inconsistencies, and creating calculated fields for analysis.
- Design the Viz: Choose appropriate visualization types (e.g., bar charts, line graphs, heatmaps) to effectively convey insights related to the selected story. Consider visual aesthetics, layout, and interactivity to enhance user experience.
- Analyze and Interpret: Use data analysis techniques to uncover meaningful insights and trends within the chosen focus area. Interpret the findings in the context of the movie industry and the specific story being explored.
- Iterate and Refine: Iterate on the viz design based on feedback and insights gained during the development process. Refine visualizations, adjust parameters, and incorporate additional features or filters as needed.
- Validate and Test: Validate the accuracy and integrity of the viz by cross-referencing with the original data source and conducting thorough testing. Ensure that the viz effectively communicates the intended story and insights.
- Submit the Viz: Prepare the final viz for submission to the Data + Movies challenge by Tableau. Follow any specified submission guidelines and provide necessary documentation or explanations to support the viz.
- Reflect and Learn: Reflect on the experience of creating the viz, including successes, challenges, and lessons learned. Identify areas for improvement and consider how to apply insights gained to future data visualization projects.
The IMDb dataset we were working with was massive, so I knew I'd have to find a smaller subject.
I wanted to look at Oscar Nominated/Winning Animated movies, looking at the films and the studios that make them. I also wanted to look at financial or critical elements to see if the Oscars are a good representation of these aspects.
Here were some sketches and ideas I had:
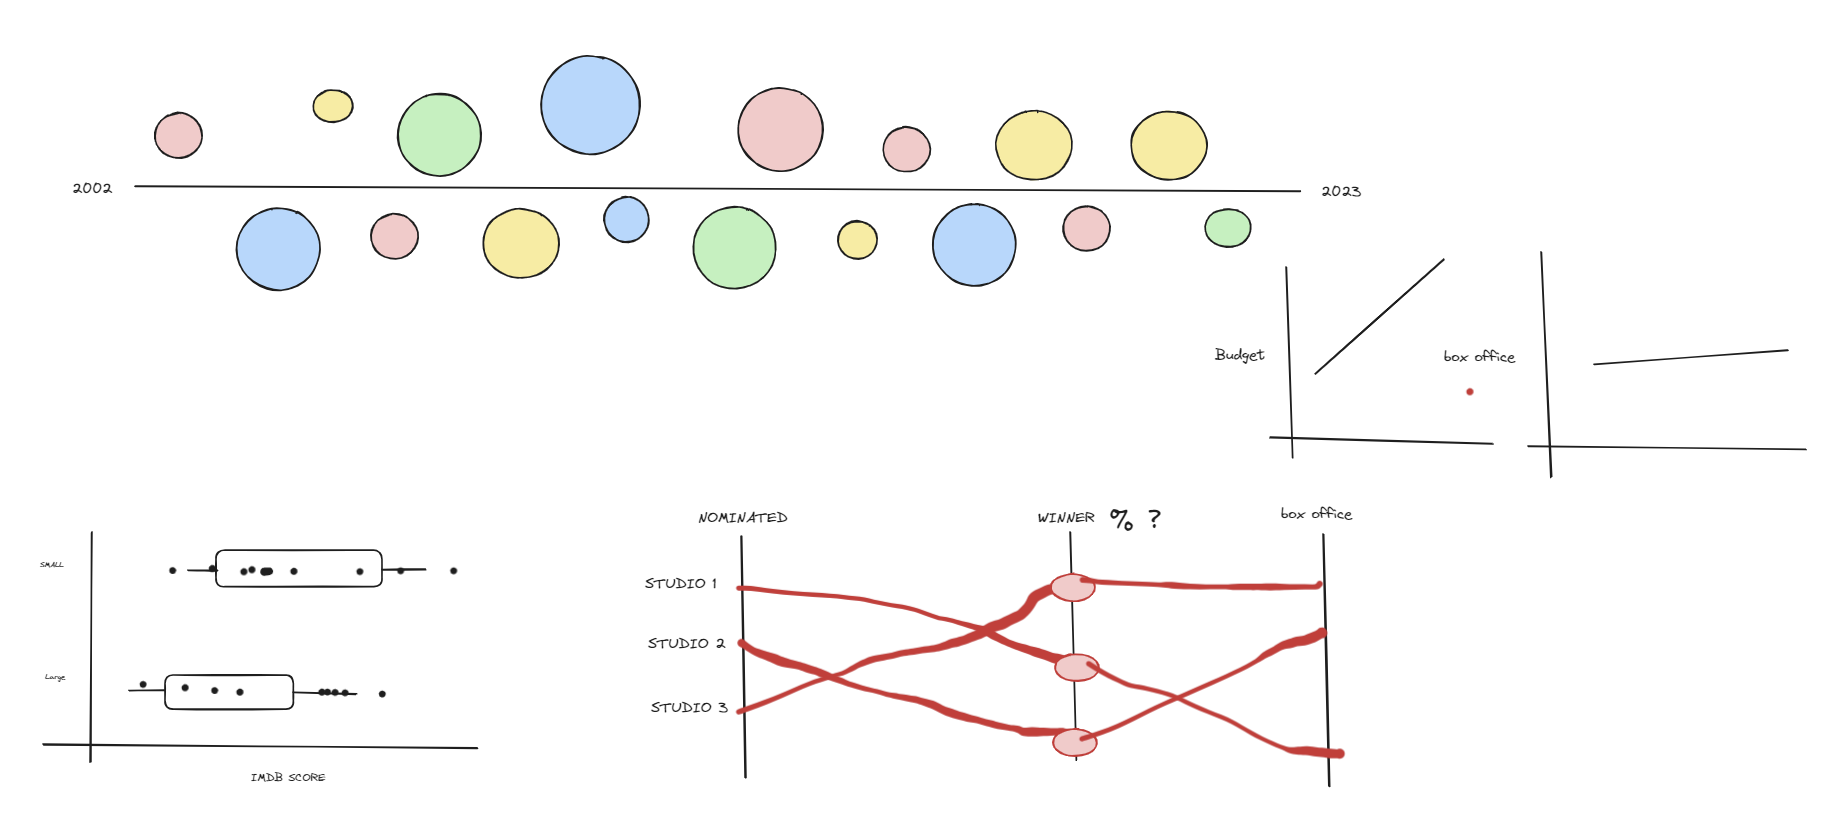
I spent a lot of time designing how I wanted my charts to look in sketch form and figma.
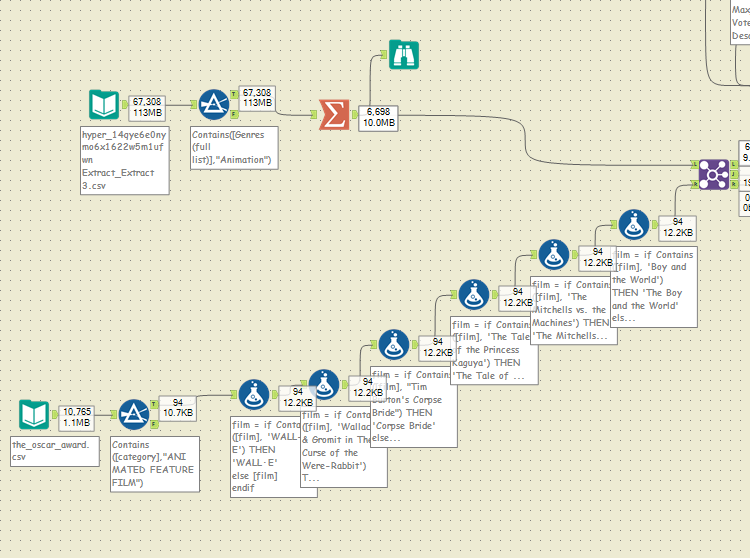
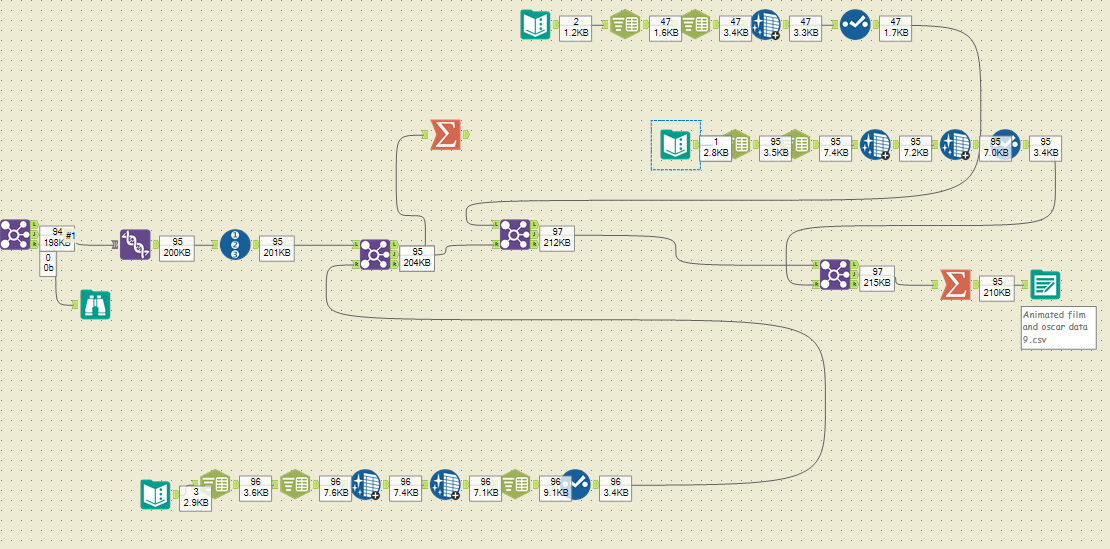
I also needed extra data on just the Oscar nominated films, here is my alteryx flow that cleaned up the film names and joined the data.
I then pulled in data for the size of the studios, film budgets and film box office revenue.
I was then able to do my visualizations:
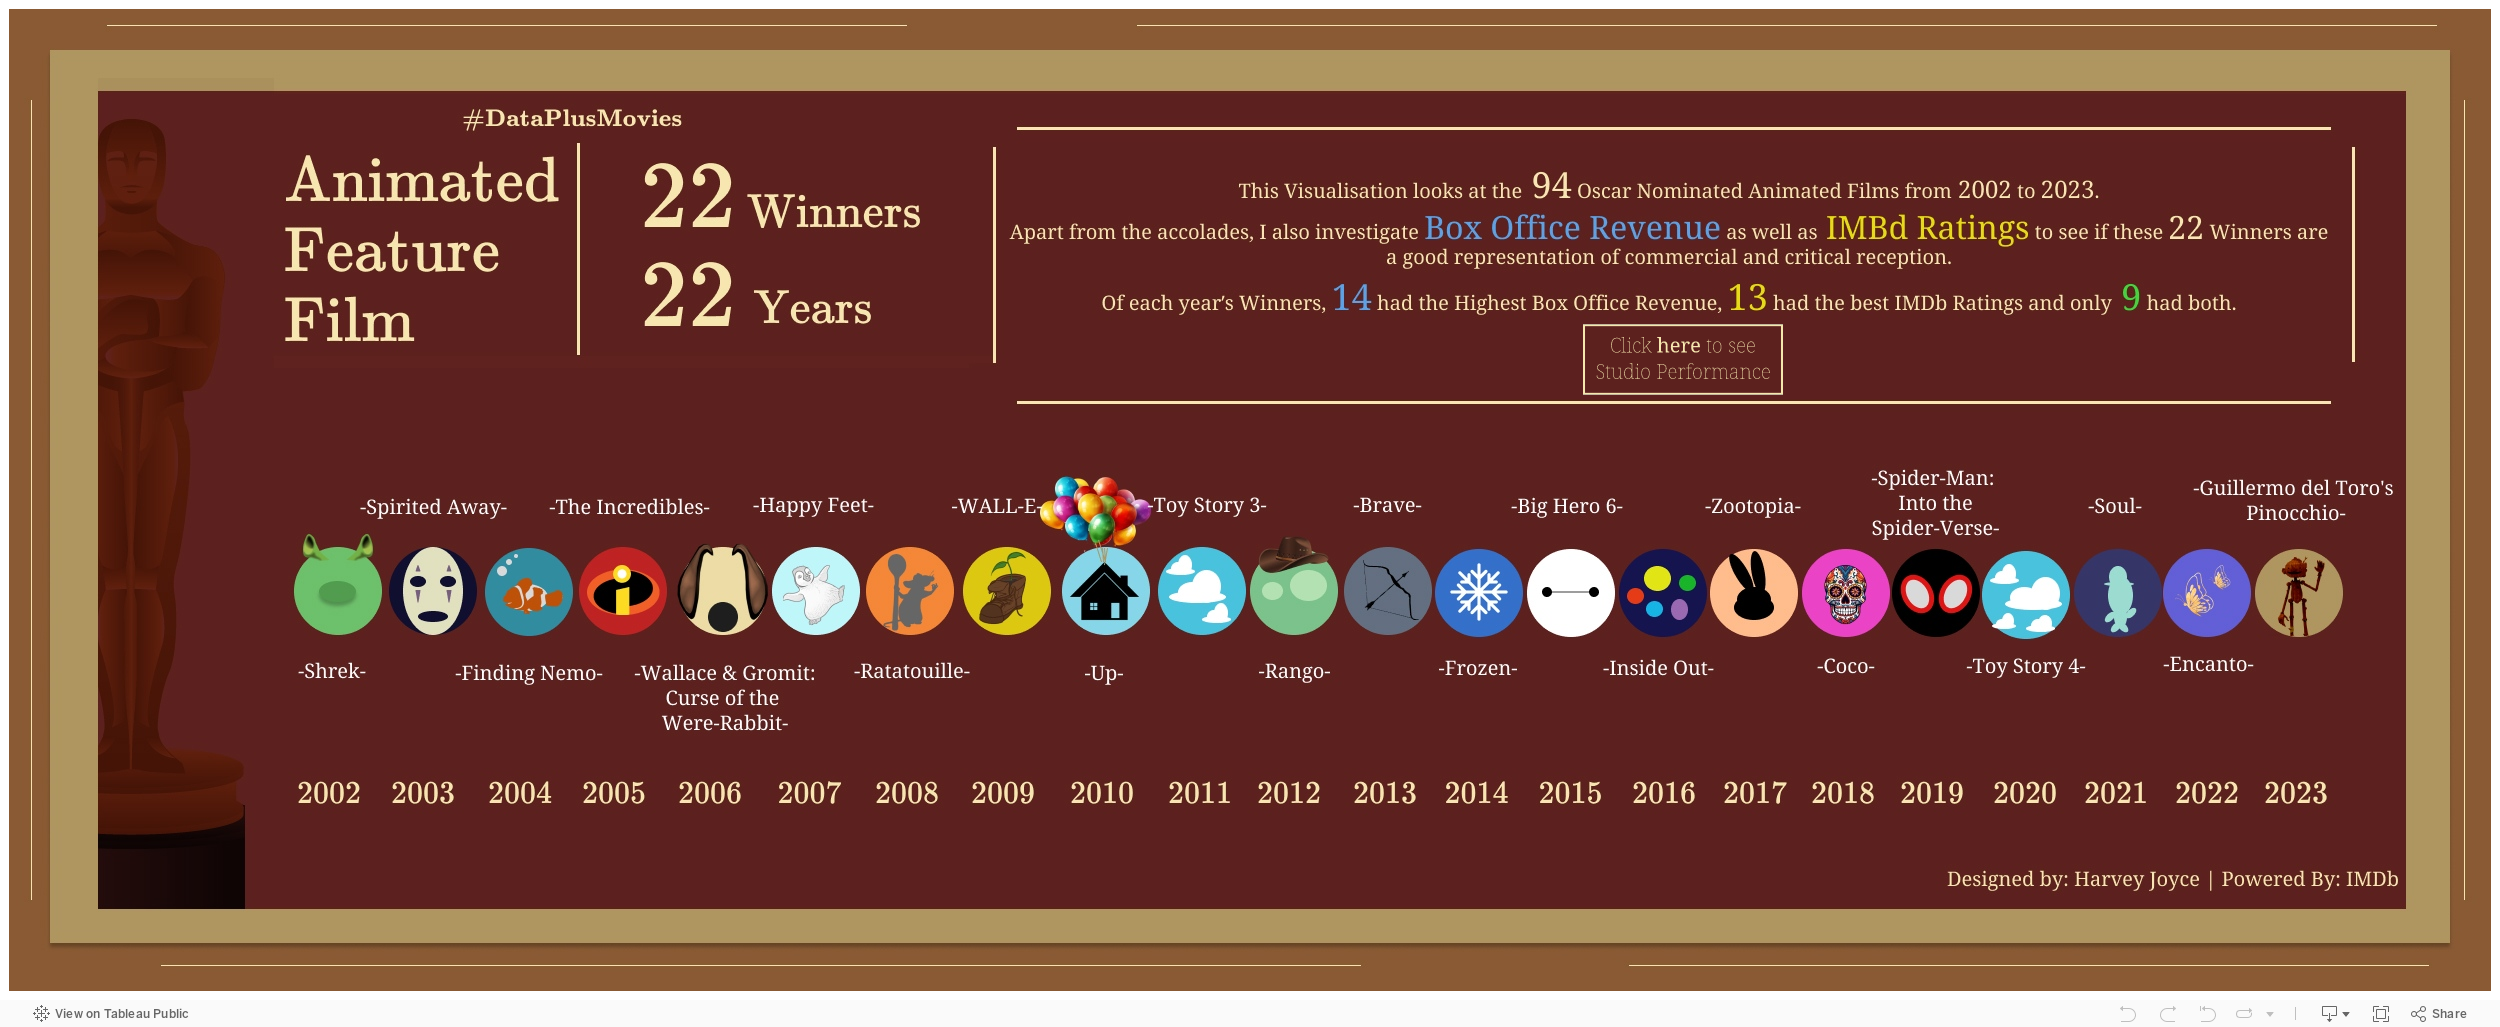
Here is the link on Tableau Public:
https://public.tableau.com/app/profile/harvey.joyce/viz/AmimatedFeatureFilmDataPlusMovies/Dashboard2