A Burndown Chart is a nice method to display how a value decreases over time. So for example if you want to display how fast a certain budget decreases over time.
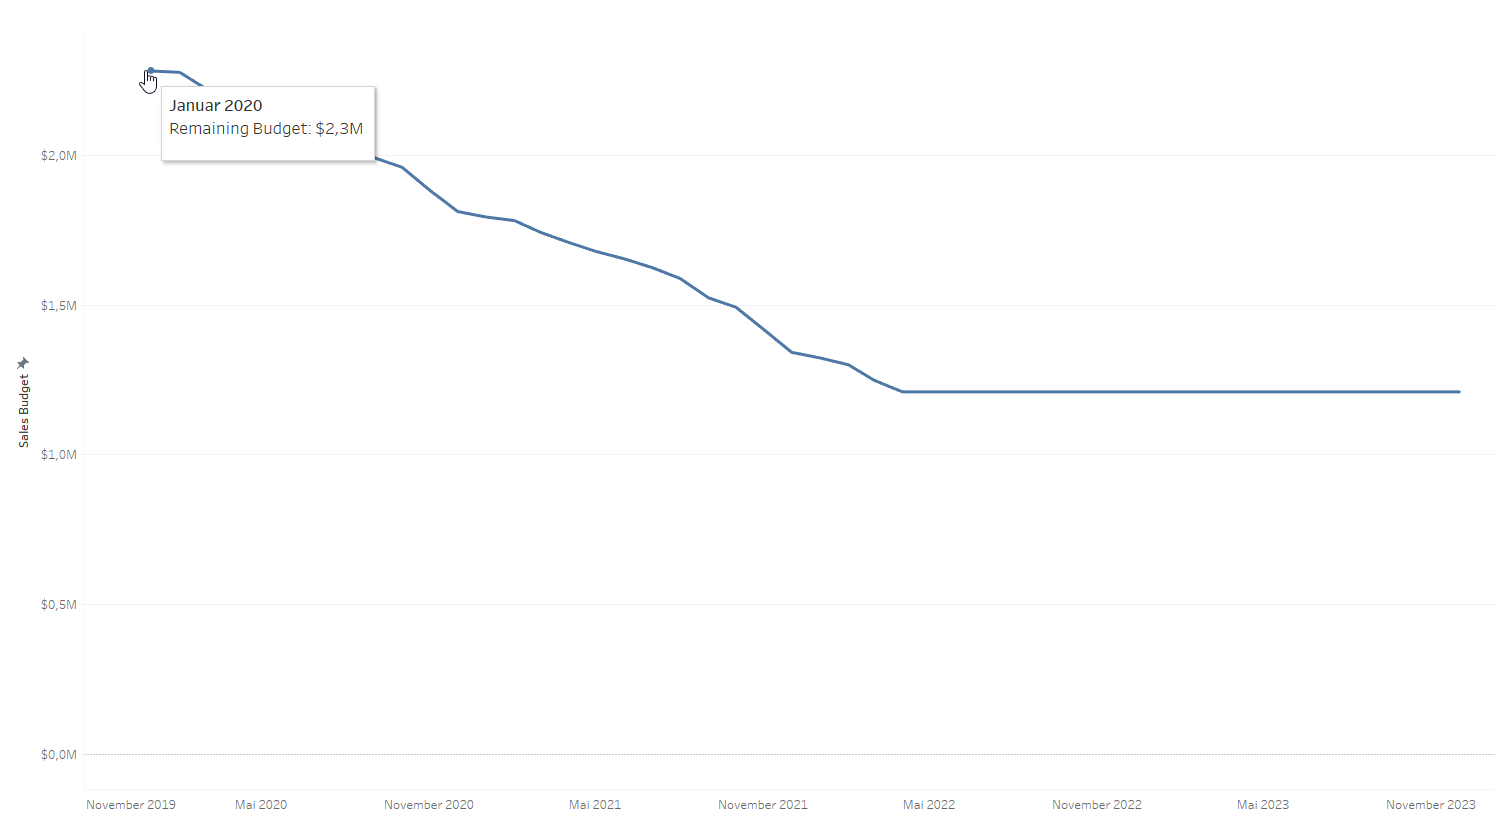
Here we can see a Burndown Chart of a modified Superstore dataset. A budget that was available from November 2019 onwards is shown. We can see how the budget decreased until the most recent date and how much of the budget is still available.
The underlying calculation is based on the sales within the superstore. The decrease is calculated using a descending Running Total.
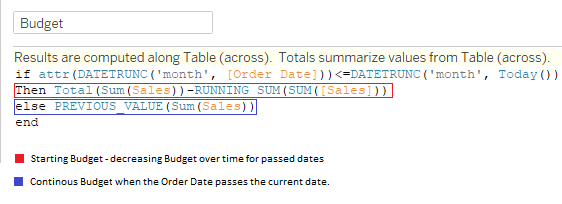
In this calculation, the decreasing running total of the budget is used if the order date is in the past. If the order date is in the future, the previous value is obtained and is continued over the remaining dates.
The “Total(Sum(Sales))” is a calculation over the whole dataset and returns the starting budget in this case. The “Running_Sum(Sum(Sales))” is returning the decrease of the budget.
The “else” case is needed for the calculation to change once the current date is passed. Then the “Previous_Value(Sum(Sales))” function is used to keep the budget that was reached until the current date.