The task for day 2 of dashboard week was to be as creative as possible given a variety of data sets and attempt to pick out a story or a visual that you have found within the 27 data sets provided on world cup historical statistics.
I decided to narrow the data down to just the 2014 world cup not just because of the memorable 7-1 thrashing of brazil but because it was the first time Greece reached the knockout stages of the world cup (still not over that Keylor Navas performance). I then wanted to have an overview page with all the countries and to be able to zoom into player statistics for the chosen team. given the data there was very little information for player statistics so I mainly got these by counting and joining in an Alteryx workflow.
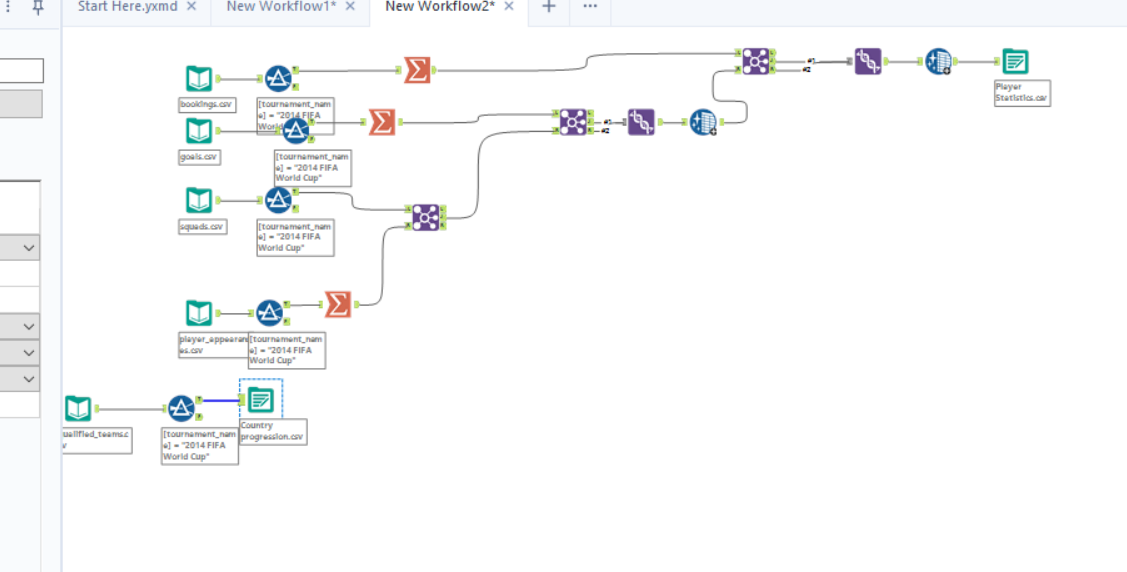
I then went into tableau and created my vision.
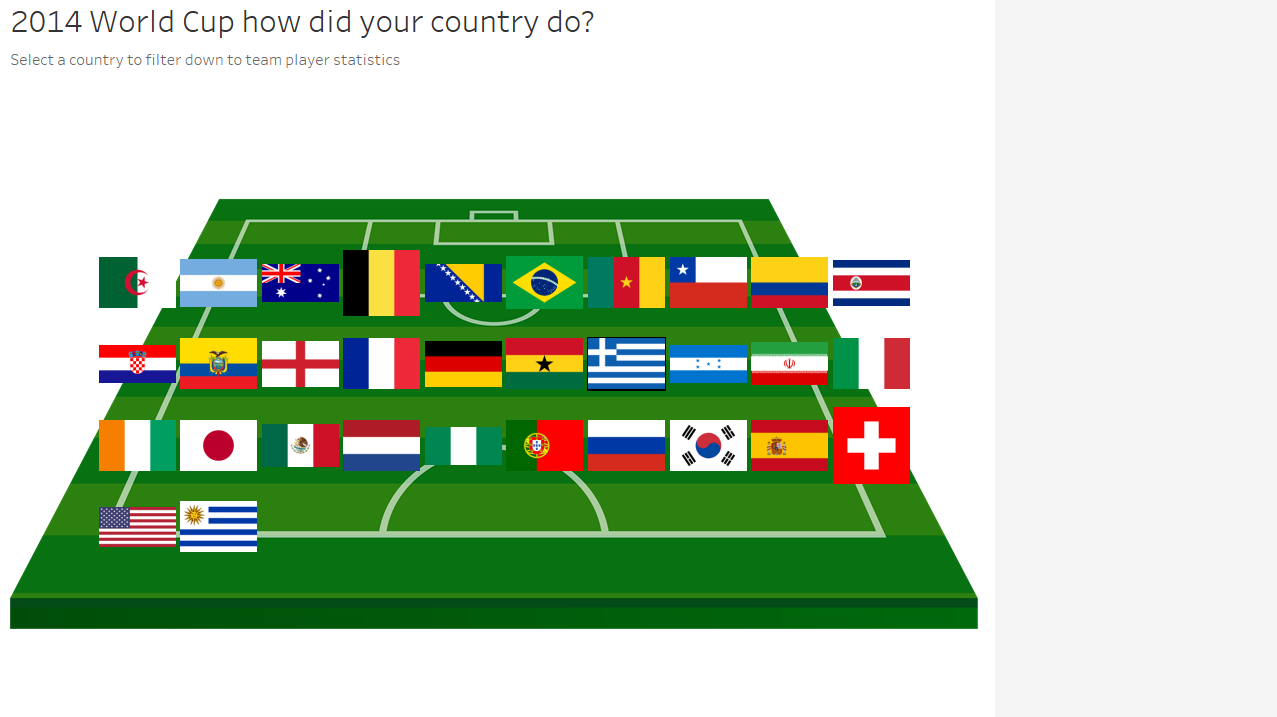
I had a overview page with all the countries and with dashboard actions when you select a country it will filter down to the chosen countries squad.
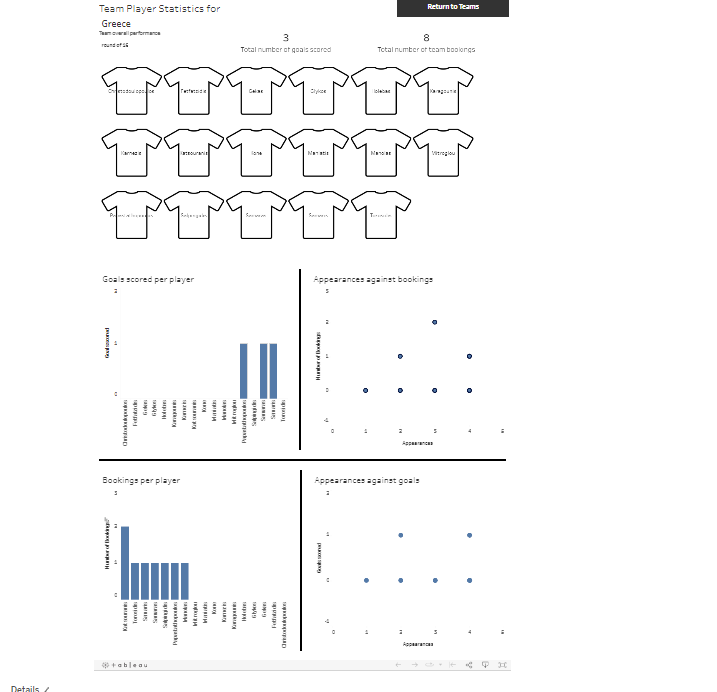
This dashboard also has a navigation button to return to the overview dashboard and with set actions and highlight actions when you click on a player they are highlighted on the chart below. For future reference I should have made the dashboards both uniform as this would avoid having to scroll on the player statistics dashboard. As well as try to incorporate statistics on goals against and clean sheets so that the goalkeeper would have some statistics to go on or filter by formation.
Overall I found this to be an interesting experience pushing our creativity with a lot of data to sort through.