Have you seen KPIs with those dynamic indicators?
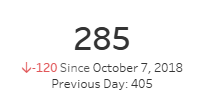

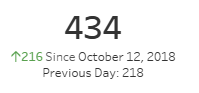
Those indicators can change to green text with an up arrow when the value indicates a positive value. When negative values are shown, the indicator is visualized with a down arrow and red text.
In this case, the value changes based on the current time compared to the previous day. When the dashboard is set to a view from a different time, these values change accordingly.
So the question is, how can I make dynamic KPIs on a tableau dashboard?
Let’s go over how to make these metrics. This tutorial will be using the following conditions:
The time period is by days and we are trying to find the number of squirrels observed on a particular day. We can then include the dynamic indicators of whether the number of squirrels observed increased or decreased in comparison to the previous day. Each row of this data set is a squirrel with a unique ID.
Here are the steps:
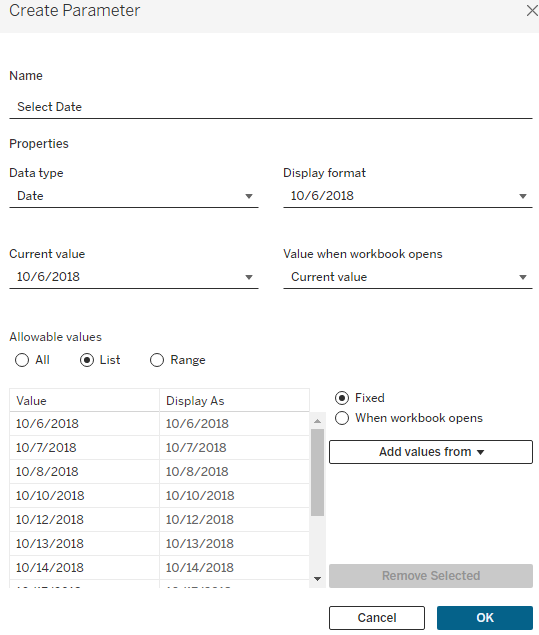
First create a parameter that holds the time
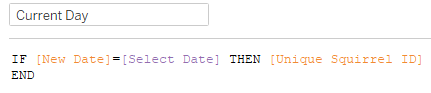
Then create a calculated field that returns the squirrel ID if the date in the data matches the parameter date.
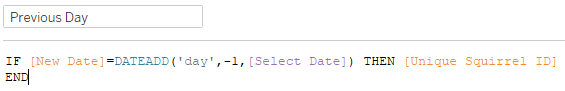
Create a second calculated field that returns the squirrel id if the date in the data matches the parameter date subtracted with 1. This is taking the previous day, however if you would like to use a different date unit, you can make the changes based on your preference.
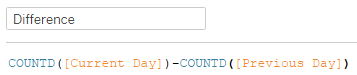
Then make a third calculated field that takes the difference of the current day selected with the previous month.
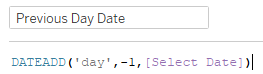
A fourth calculated field will give the previous time that we are comparing to.
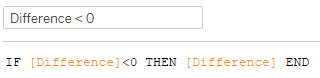
Now here is the crucial part of this indicator. We need to create two calculated fields that give us the difference depending on whether the difference is greater than or less than zero.
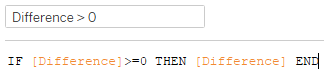
We have all the fields and it is time to piece them into a sheet. Here is an example of how I placed the fields created above:
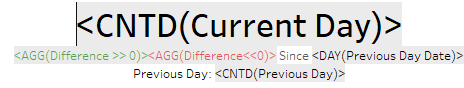
The “difference” fields are placed right next to each other, and do not worry about them both appearing at the same time. Only one of the two field conditions will be true at a time and only the field that has the condition met will appear.
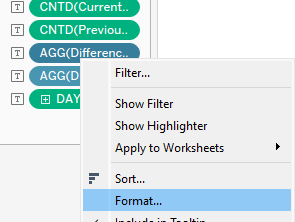
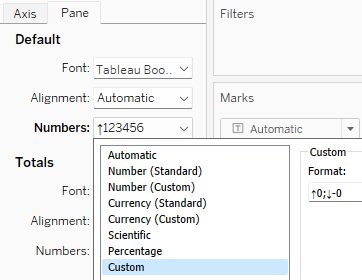
Finally, we would like to include the dynamic arrows for the indicator. We will need to format each of the “difference” fields and make a custom number “↑0;↓-0”
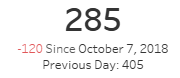
Here is the final result!