A Geocities and Retro Inspired Visualization on Boybands.
Final day of the "Dashboard Week". Andy decided to give us an amazing dataset: The Boyband Dataset. I really wanted to learn more about custom shapes and embedded URL use in Tableau and this dataset was perfect! For each billboard songs there was a youtube link attached!
I made a connection between eighties, nineties, teenagers magazines, geocities, and...i had an idea..a really bad one!
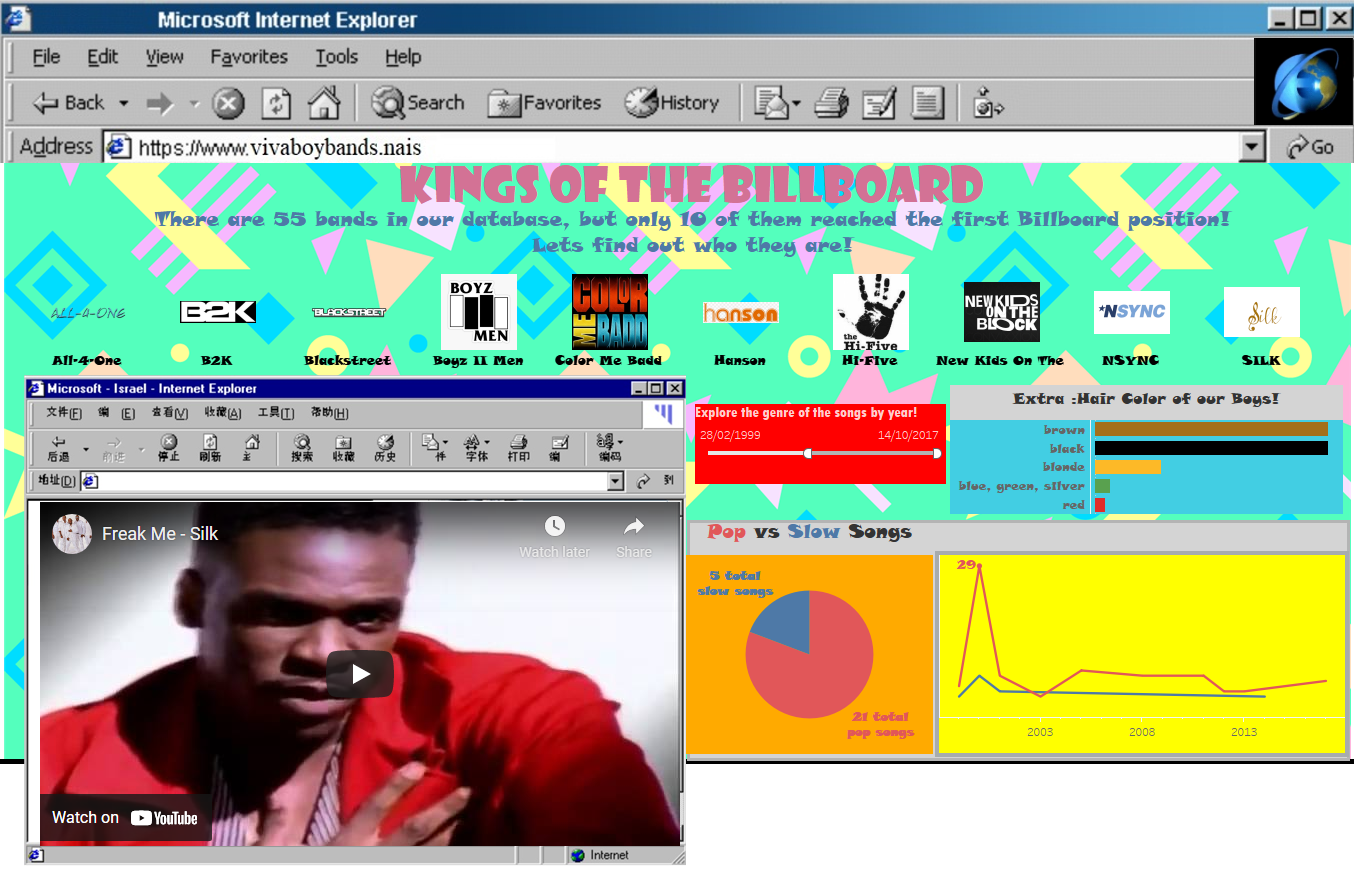
Everything in this viz is very badly designed: I wanted it to look like it was made directly in the 90s. You can see the top 10 bands that reached the number one in the USA billboard, the album cover of the song...and...the video of the song directly in the dashboard! I had a lot of fun with it: even if it is cheesy and messy, it was REALLY useful because:
- I learn how to assign custom different shapes to the same members of a set.
- I finally understood how to insert web content in my vizzes. The video that you see on the bottom part of the viz is changing dynamically when you select one band, and it shows the video of their billboard song featured in the dataset.
- I have learned that there is no easy way to add a background image to a dashboard, unless you want to make everything a "Floating" element (very very bad viz practice).
I felt a bit stressed and I tried to use the last day of the Dashboard week to learn something technical that I wanted to practice since a bit of time. If you want to play a bit with my viz click HERE , i suggest to experience it full screen for a total nineties experience.
I hope that this viz made you smile!
Now....enjoy your friday!