One great thing about Tableau is just how customizable it is to the user. Each user's Tableau could be vastly different in terms of colours, color palettes, custom shapes and other user edited features.
This blog is a succinct walkthrough on how to add your own shapes to your charts, to add that bit of flair and individuality to your visualisations.
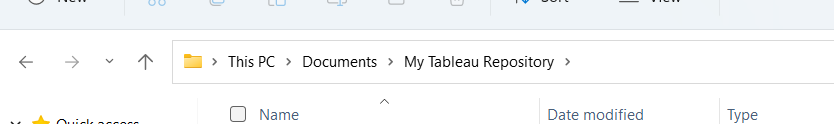
Step 1: Firstly, you have to find the shape image you would like. Google is your friend here, and be mindful of any copyright rules you may have to adhere to when downloading and using images off the internet. Save the image to your computer and then go to your file explorer. This is the file path of the folder you need to save your newly downloaded image to:
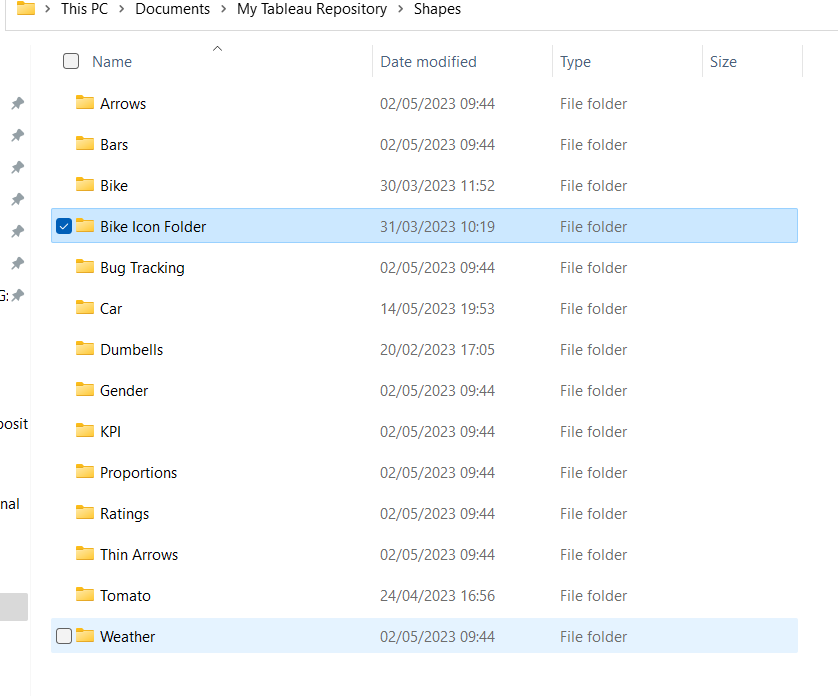
Step 2: In the tableau repository folder, click on Shapes. And then create a new folder within this one titled according to your newly downloaded image. Move the image from your downloads into this appropriately named new folder.
Step 3: Go back to tableau and when you go to add a shape to your graph, there should be a reload shapes option:
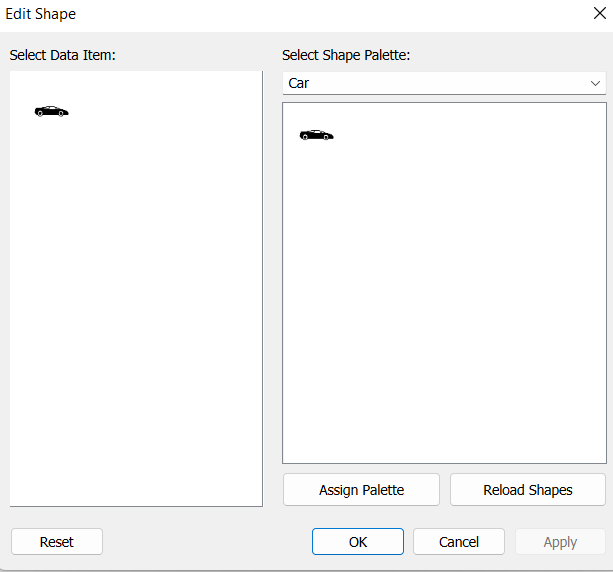
Press reload shapes, and then you should be able to find your custom image brought in from the internet. You might need to play around with size in the marks pane to get it fitting right.
It's a very simple and easy process and allows us just that bit more flexibility and creativity when we're visualizing our data