So today, like most days, I started out with a plan for the day (data discovery, prep, design etc). However, I did not follow it as Alteryx and Tableau did not appreciate the overload of data (which I only found to be a problem when I tried to create the graphs in Tableau) - so it became a bit of an iterative process/day.
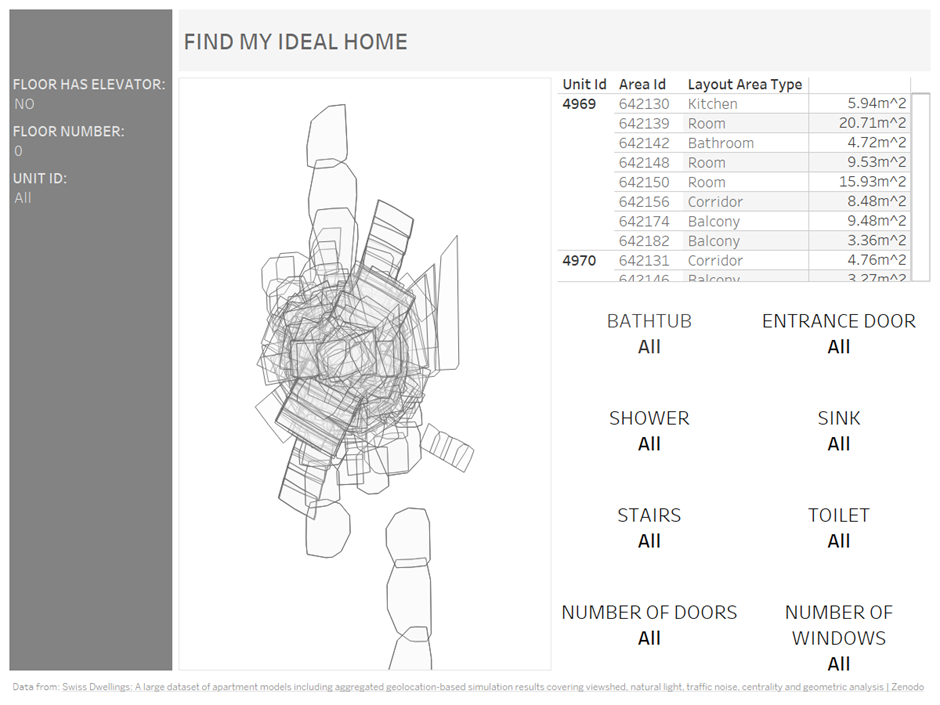
After looking at the data, Swiss Dwellings: A large dataset of apartment models including aggregated geolocation-based simulation results covering viewshed, natural light, traffic noise, centrality and geometric analysis, I had a user story in mind. I wanted to create a dashboard for potential homeowners to identify their perfect home based on what they deemed important. Although I knew what I wanted to show, I didn’t know how I wanted to show it. My sketch had one graph on it – the units (apartments) and a note for filters and the rest was to be confirmed. I initially tried to keep as much of the data as possible (after filtering to only keep residential properties), but as previously mentioned, Alteryx wasn’t having the best time. Subsequently, I reduced the amount of data.
Fast forward past all the moments of frustration, I finally had something I could work with in Tableau. I had all the geometries of the units (size relative to each other), I created parameters to allow users to specify if they only want to see floors that have elevators or not and the floor number. By clicking on a unit, it filtered the table to show the number and type of areas (room types) in the particular unit and the associated area (actual area - m^2). This table is then also used as a filter to show the KPIs below (relevant to the chosen area). I also considered buyers who have previously had a meeting with an agent and know the unit(s) that they are interested in and need a reminder of specs when making their final decision – this is where the unit ID filter comes in handy.
My final dashboard is below. Based on the feedback I received – seeing the unit geometries when hovering over the unit in the table is more beneficial. I will also be fixing my current geometries to show all the areas within the unit itself.