Line charts are a useful way to visualise the individual trends over time, but what if we need to visualise the distribution of data as part of a whole over time? In this post we are going to look at a simple and effective possible solution: the stacked area chart (showing the % of total).
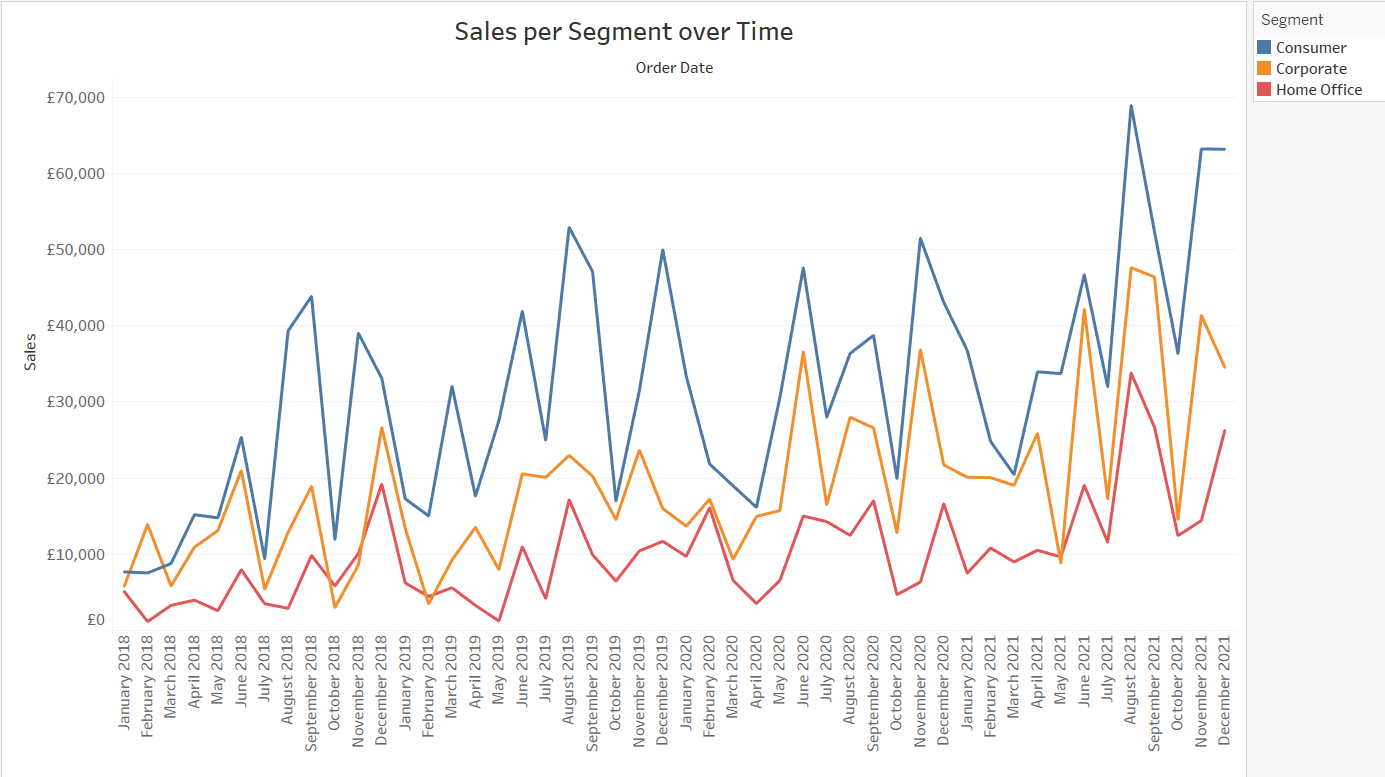
From the example below, it is possible to build a stacked area chart to show the contribution - as a percentage - of each Segment to the total Sales (our 100%).
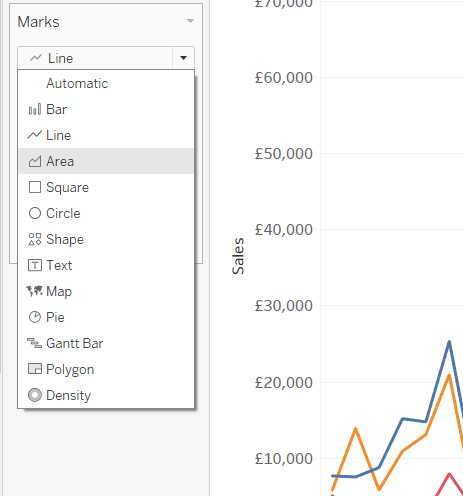
To build the stacked area chart, select Area from the mark types:
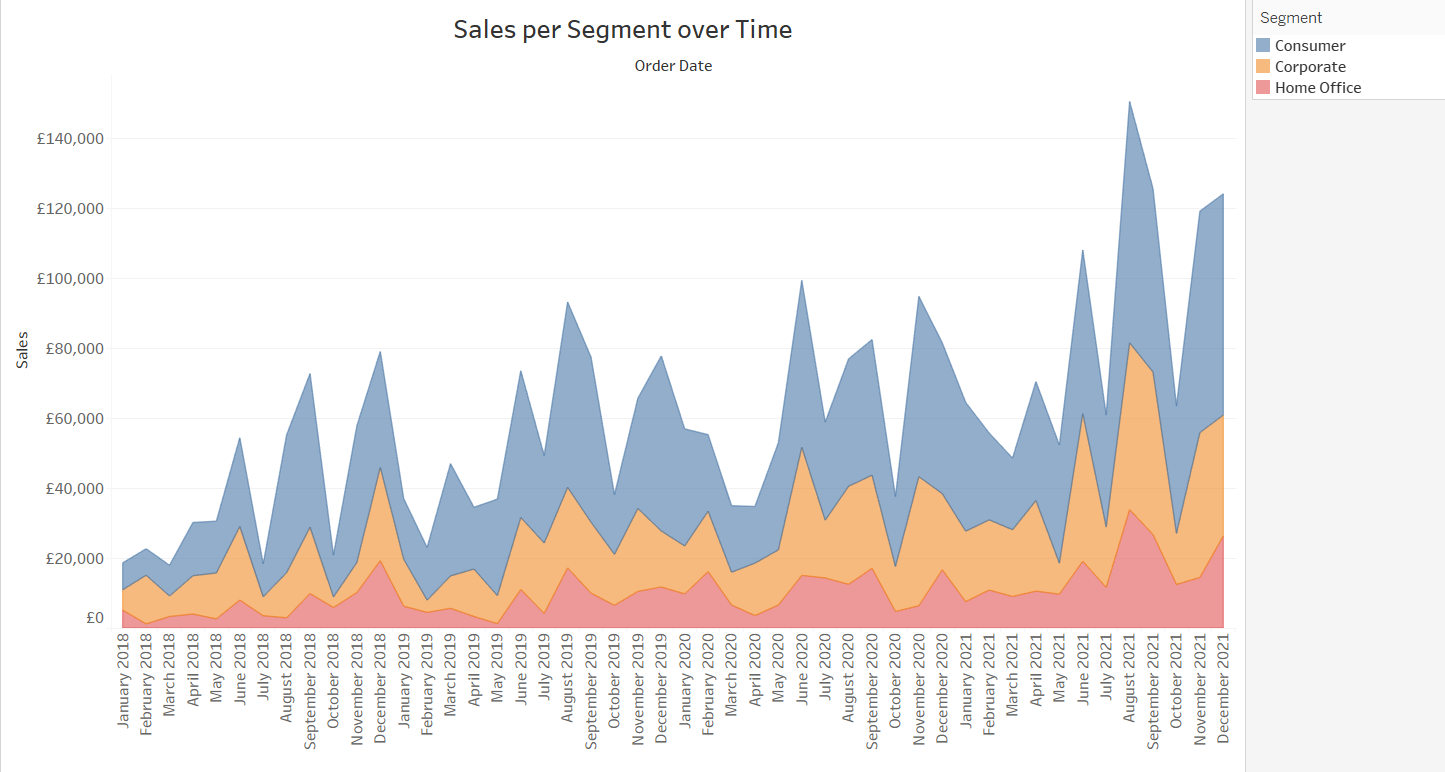
We should see the following chart:
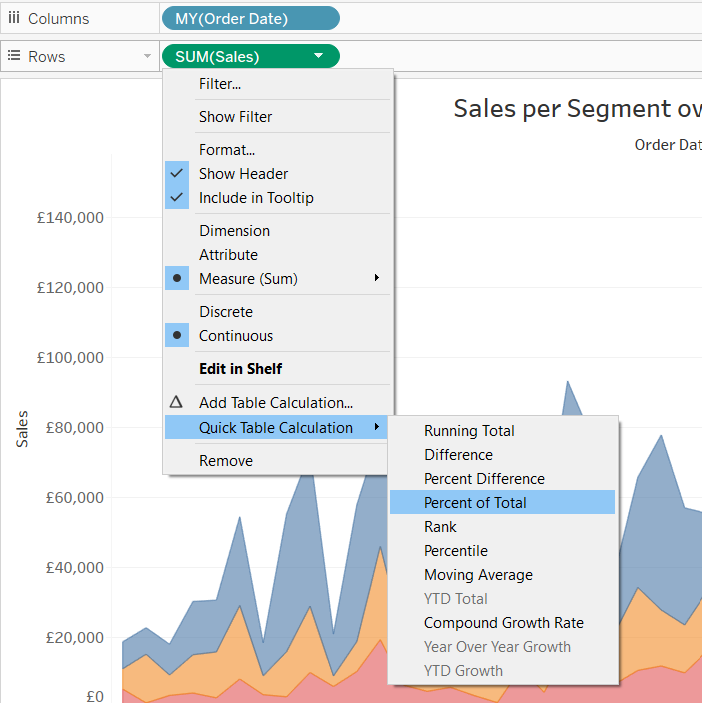
Now we need to show the values as a % of total. To do that, right click on the measure (in this case Sales) in the chart, select Quick Table Calculation and Percent of Total:
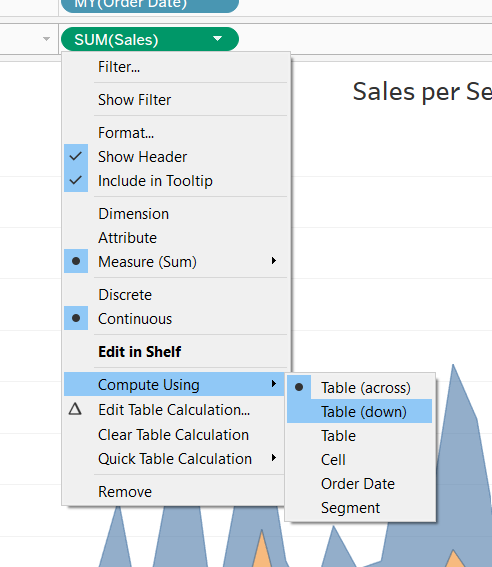
We should have now changed the y-axis into a percentage; however, as it is now, the result is not really helpful. We need a final step: right click again on Sales and hover over Compute using, then select Table (down):
There you have it! The result should look like this:

