Intro
Today we were using Power Bi which we did not have much experience using, we had only had one lesson on the software so we had to take a different approach when coming into it, as usually with tableau we know exactly what the limitations of the software are and what it is and isn't capable of. With Power Bi however, we only had a very introductory knowledge of so we did not know what was and wasn't possible with the tool.
Steps
I started the task as usual with data discovery, even though I knew id be using Power Bi I chose to use tableau prep to do my data discovery as I'm very familiar with it now and find t the best tool. The only cleansing I needed to do was change some field data types and format a column, but I did discover a limitation for what I originally wanted to do.
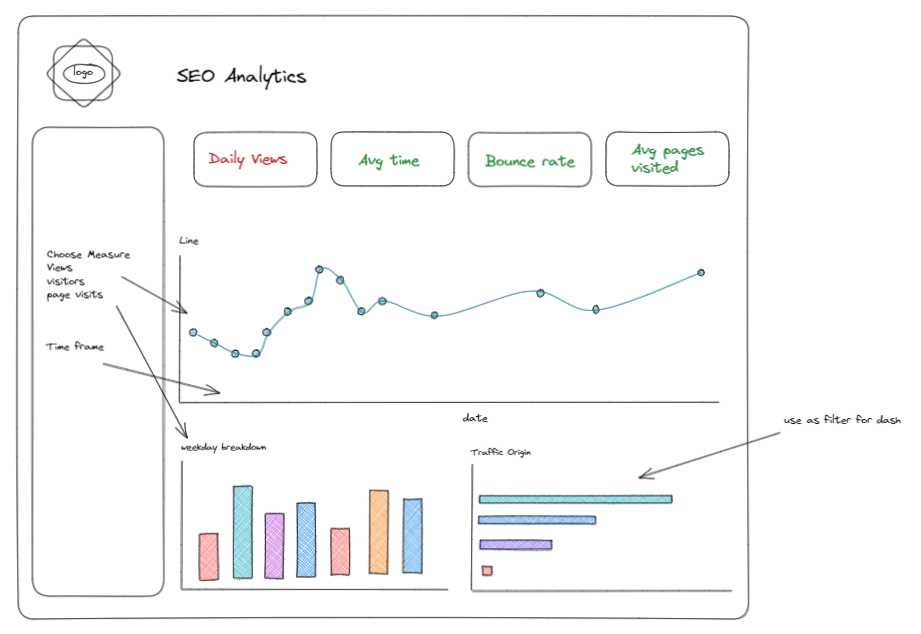
I then made a quick sketch of what I wanted to create with my original ideas as i knew i could get around the problem I found later. I stuck with a pretty basic layout that met the SEO theme I was going for.
Then I got started in Power Bi, if I'm honest, the majority of my time was dedicated to formatting and trying to get the filter/ parameters to work. I know I could have created this dash in 5 mins in tableau but in Power Bi was a different story.
Once I got the basic charts and KPI's onto the dash I began trying to research if a measure change parameter was even possible, a found a few guides and tutorials that lead to dead ends but after reaching out to a member of TIL i was able to find a solution to my problem. I wish I reached out sooner as the fix was very convoluted and I could have never found it myself or find a relevant video for it.
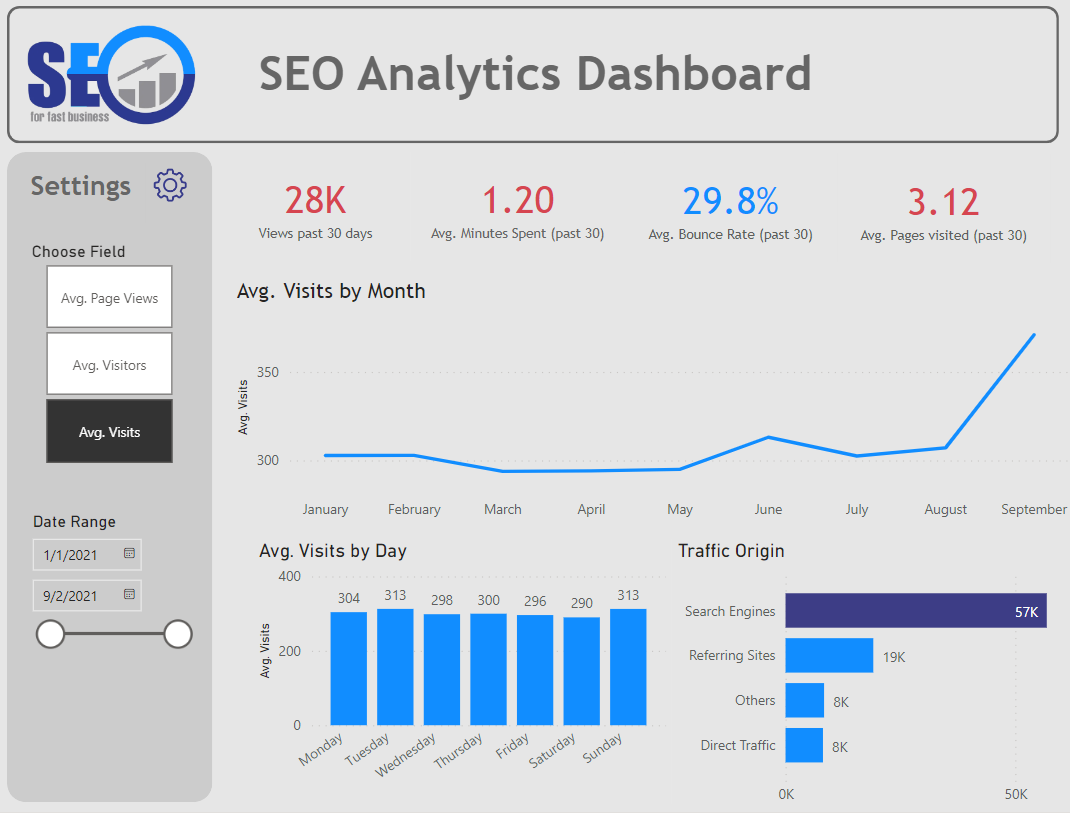

I then did the layout of my dashboard to get it looking a little nicer and I was happy with the end result, I wish I was able to do more complex fields and put them on colour so that I could make the dashboard dynamic with new rows of data, but for a one time static data source it does the trick.
Similarly I wish I could more manually control the tooltips of the KPI's so that I could make them more informative at showing the change from previous months but unfortunately this is either not possible or I do not know how to do it.