This week we dove deep into the depths of Tableau Server. We learned how to build our own servers and how to view the status of processes running in Tableau Server.
My favorite part of this lesson was looking at the various pre-built Tableau Server Analysis Dashboards. Although the dashboards are relatively lack-luster, the data feeding into them is very interesting and valuable and I was surprised to learn that this type of data was readily available for us to analyze.
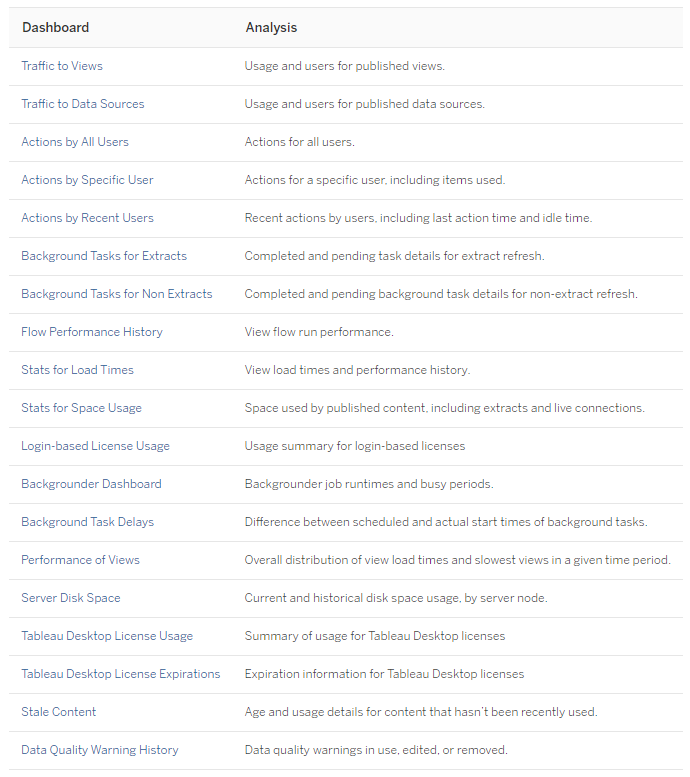
I can see this data being used as a client-delighter while on placement. Maybe not necessarily something I would expect to be tasked with directly but could be a project to bring to the table to help a client really understand their server usage. My favorites of these dashboards include:
●Stale Content (age and usage details for content that hasn't been recently used) - This can help with overall organization and removal of any old dashboards not being used which I imagine some clients have a plethora of.
●Background Tasks for Extracts (complete and pending task details for extract refresh) - If the system is experiencing slowness, this could be a quick way to make sure it's not just an accidental query running for hours in the background.
●Performance of Views (overall distribution of view load times and slowest views in a given time period) - Another great piece of information to help improve server performance and maybe uncover inefiiciencies before a client knows they need it.
JMac also brought up an interesting ask, how can we use TS Web Requests (ie. specific actions performed on a given view like filtering, etc) to further our understanding of what is being used on the dashboard? This jumped out at me because finding the answer to this really would be the holy grail of user feedback. It could help us understand what filters (if any) are being used the most, which charts are being interacted with versus looked over and so much more. When the users aren't giving much in the way of feedback, it would be incredibly empowering to be able to use this data to make decisions.